AI Investigates a Chemical Feed Pump Failure: Real-Time Alarm Diagnosis on a Live SCADA Gateway
Six alarms fire at once on a water treatment plant. Alum feed rate drops to zero. Settling basin turbidity spikes. Filter differential pressure climbs. Effluent quality degrades. Chlorine residual falls. pH dropping.
An operator sees six problems. But there is only one root cause. The question is: which alarm is the cause, and which five are symptoms?
We gave that question to Claude — connected to a live Ignition 8.3 gateway through the Ignition MCP server — and watched it trace the cascade back to its source. No scripted playbook. No pre-built dashboard. Just an AI with live access to tags, alarms, and process data, reasoning its way through a plant upset in real time.
Every screenshot below comes from a single continuous session on a live gateway. This is not a concept or a mockup.
The Setup
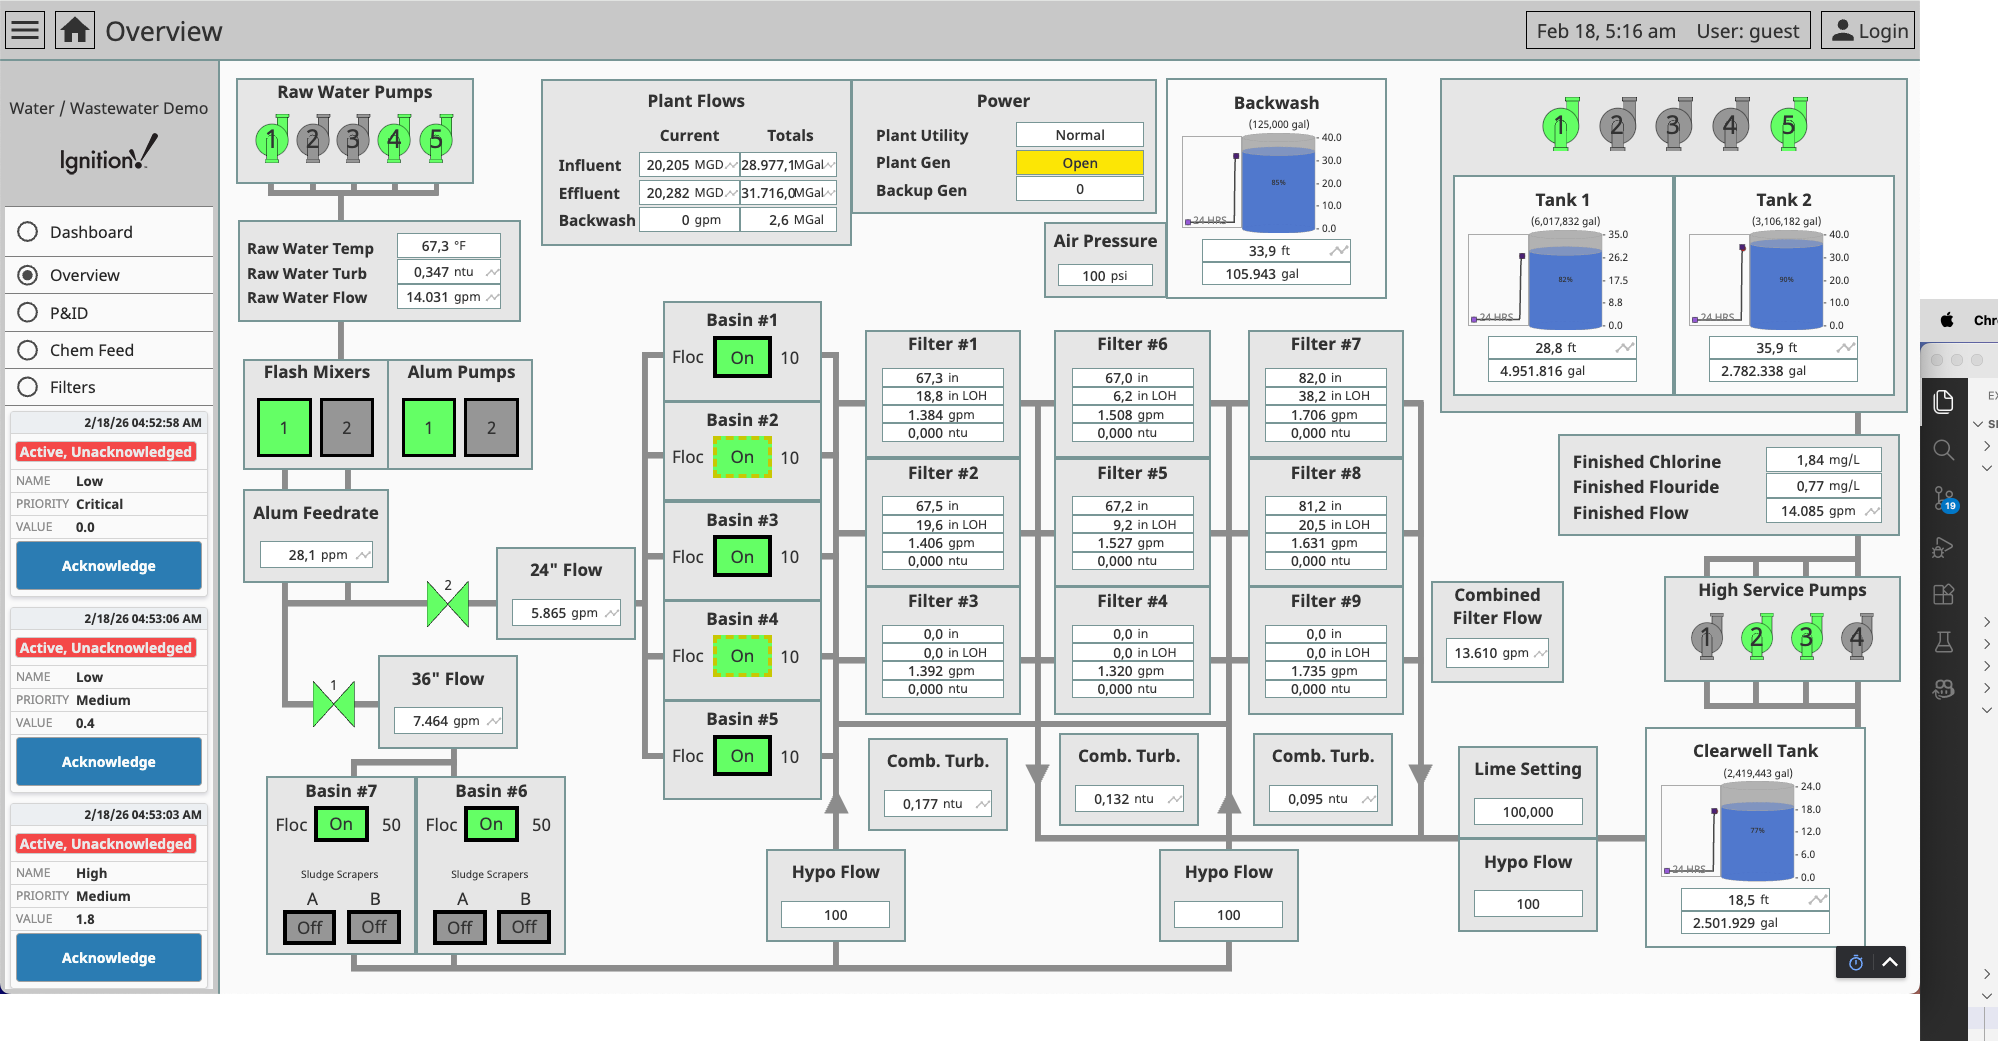
The gateway runs a full water treatment plant — raw water pumps draw from the source, chemical feed pumps inject alum coagulant, flash mixers blend it into the flow, settling basins let solids drop out, a bank of filters removes remaining particulates, and a hypochlorite system handles final disinfection before water moves to the clearwell and out to distribution.
The scenario simulates what happens when the chemical feed system fails. A script writes upset values to the plant's tags in four timed stages — mimicking the way a real pump failure cascades through downstream process areas:
- Chemical feed pumps trip — alum dose rate drops to zero, flash mixer stops
- Settling basins degrade — turbidity spikes (no coagulant), pH drops
- Filters overload — high differential pressure from increased solids load
- Disinfection compromised — chlorine residual drops below safe limits
The tags have alarm configurations. As each stage fires, alarms activate on the gateway — creating the kind of multi-alarm event that operators deal with regularly. By the time the last stage completes, six active alarms span three process areas. An operator looking at the alarm banner sees all six simultaneously. The challenge is figuring out which one started it.
The Prompt
The Ignition MCP server works with any MCP-compatible client. We ran this investigation from two: Claude Code in the VS Code terminal, and Claude Desktop as a standalone app. Same MCP tools, same gateway connection, same results.
We type a single instruction:
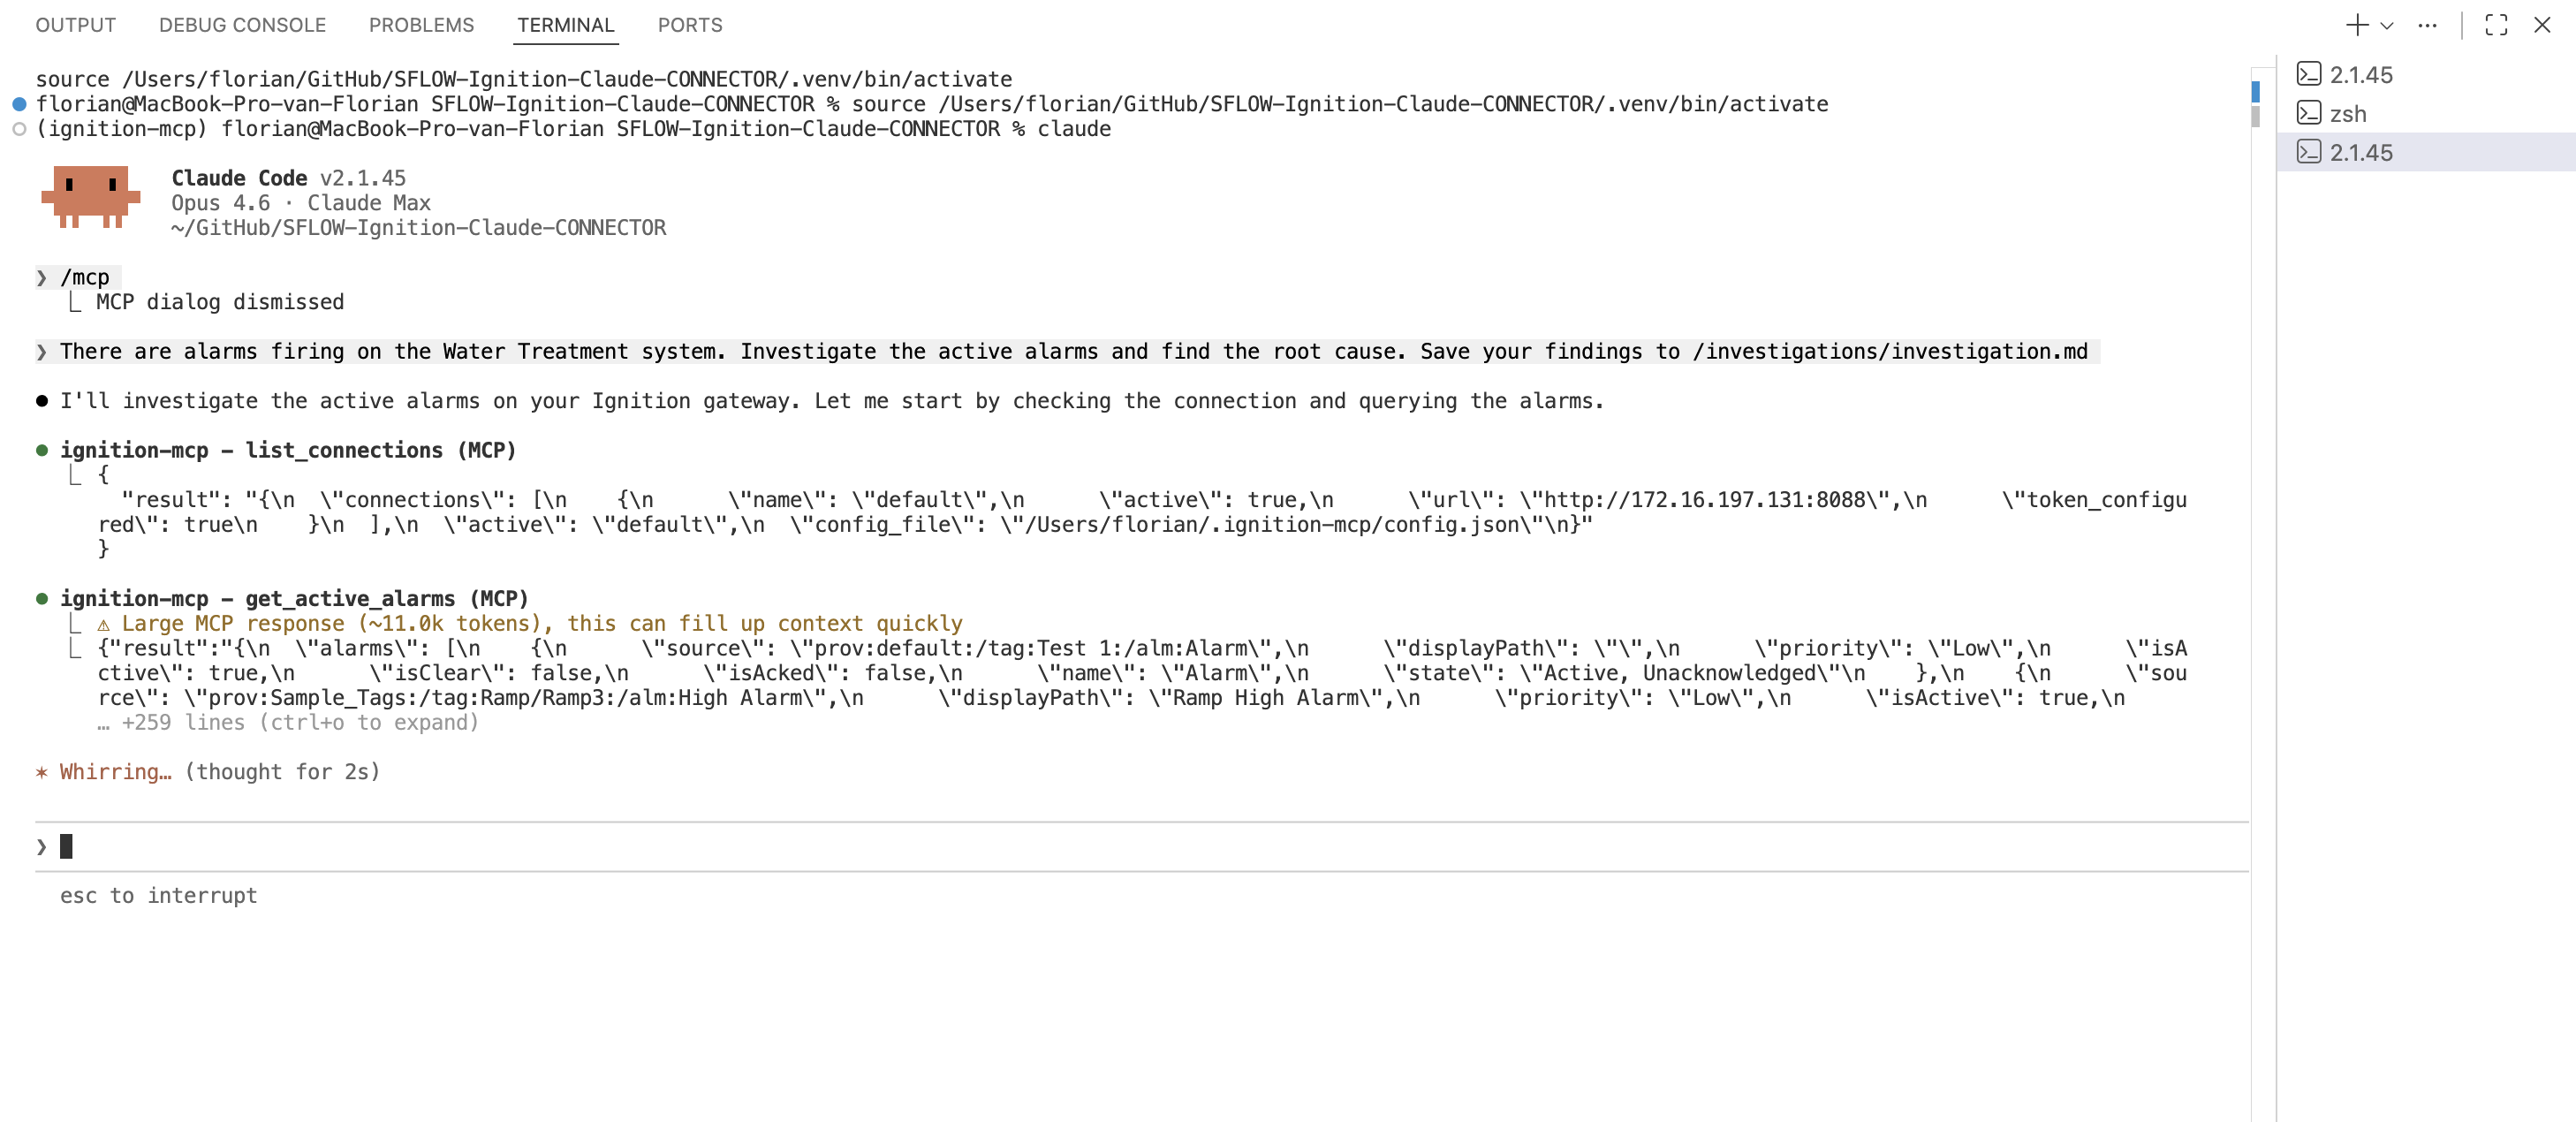
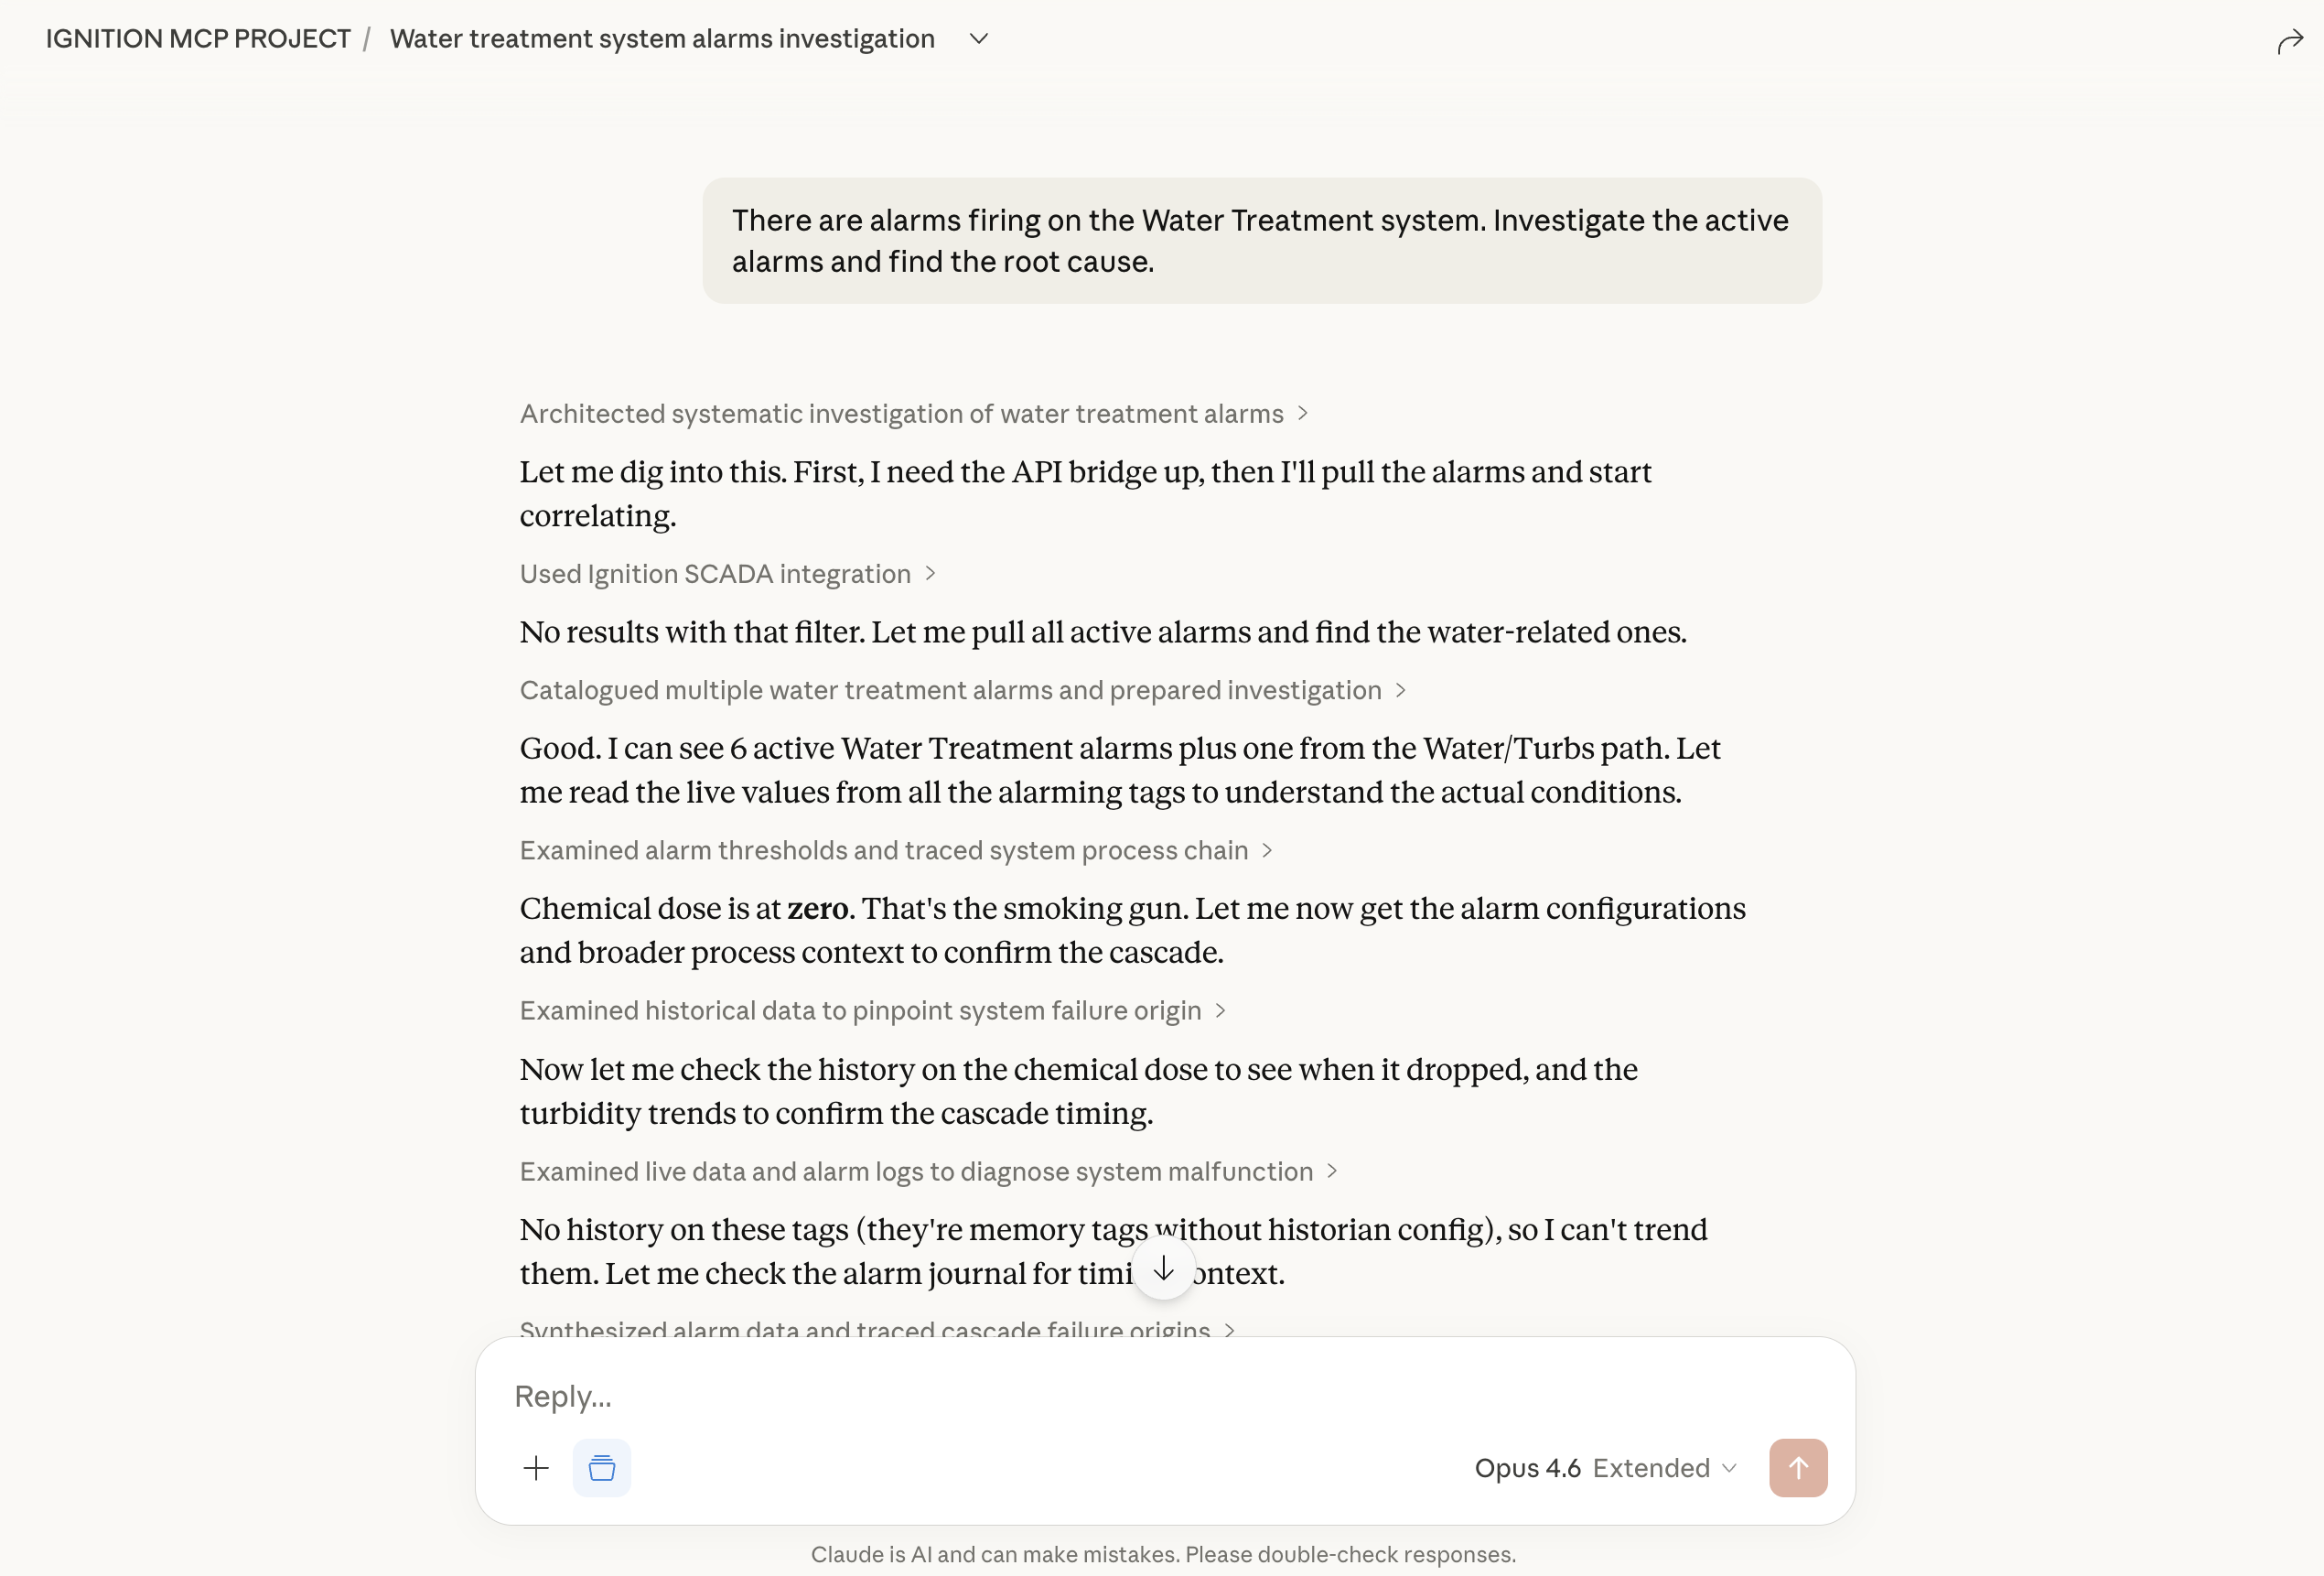
There are alarms firing on the Water Treatment system. Investigate the active alarms, find out what's happening, and determine the root cause.No specific instructions about which tools to use, which tags to check, or what the process structure looks like. Claude has to figure all of that out by querying the live gateway.
The same prompt in Claude Desktop produces the same investigation — Claude connects to the identical MCP server and calls the same tools against the live gateway.
The Investigation
Claude works through the problem systematically — each tool call informed by the results of the previous one.
First, it pulls the active alarms. get_active_alarms returns six alarms across three process areas: Chemical_Dose Low (Critical), Turbidity High, pH Low, Filter1_DP High, Effluent_Turbidity High, and Chlorine_Residual Low. Claude immediately recognizes the pattern — alarms span consecutive stages of the treatment process, and one of them is Critical priority. This is not six independent problems. It is a cascade.
Then it maps the plant structure. browse_tags reveals five process areas in order: Intake, Clarifier, Filtration, Disinfection, Distribution. This is a sequential process — water flows from intake through chemical dosing and settling, passes through the filter bank, gets disinfected, and moves to the clearwell. The alarms sit in three consecutive stages. If the problem starts upstream, it would naturally cascade downstream. If it starts downstream, the upstream stages would be unaffected.
The pattern points upstream. Claude checks the chemical feed system.
It reads the equipment tags — not just the ones in alarm. read_tag_values on the upstream stage reveals the smoking gun: Chemical_Dose = 0.0 (the alum feed pumps are delivering nothing) and Mixer_Running = False (the flash mixer has stopped). Chemical dose at zero explains everything downstream. Without alum injection, there is no coagulation in the settling basins. Without coagulation, turbidity rises. High-turbidity water overloads the filter bank. Overloaded filters pass contaminants to disinfection. The hypochlorite system cannot compensate, and chlorine residual drops. Combined with the flash mixer being down, this points to an equipment failure — not a chemical supply issue.
One equipment failure. Six alarms. Three process areas.
It confirms the cascade direction. read_tag_values on the filter bank and disinfection system shows elevated differential pressure across Filter 1 and low chlorine residual — exactly what you would expect when settling basins send untreated water downstream.
It checks the timeline. get_alarm_journal shows the Chemical_Dose Low alarm fired first (Critical), followed by the settling basin alarms (turbidity, pH), then filter bank alarms seconds later, and the disinfection alarm last. The chronology matches the process flow direction exactly — upstream to downstream.
It rules out operator error. query_audit_log shows no recent operator actions on the water treatment system. No manual writes. No configuration changes. This was an equipment failure, not an operator mistake.
The Report
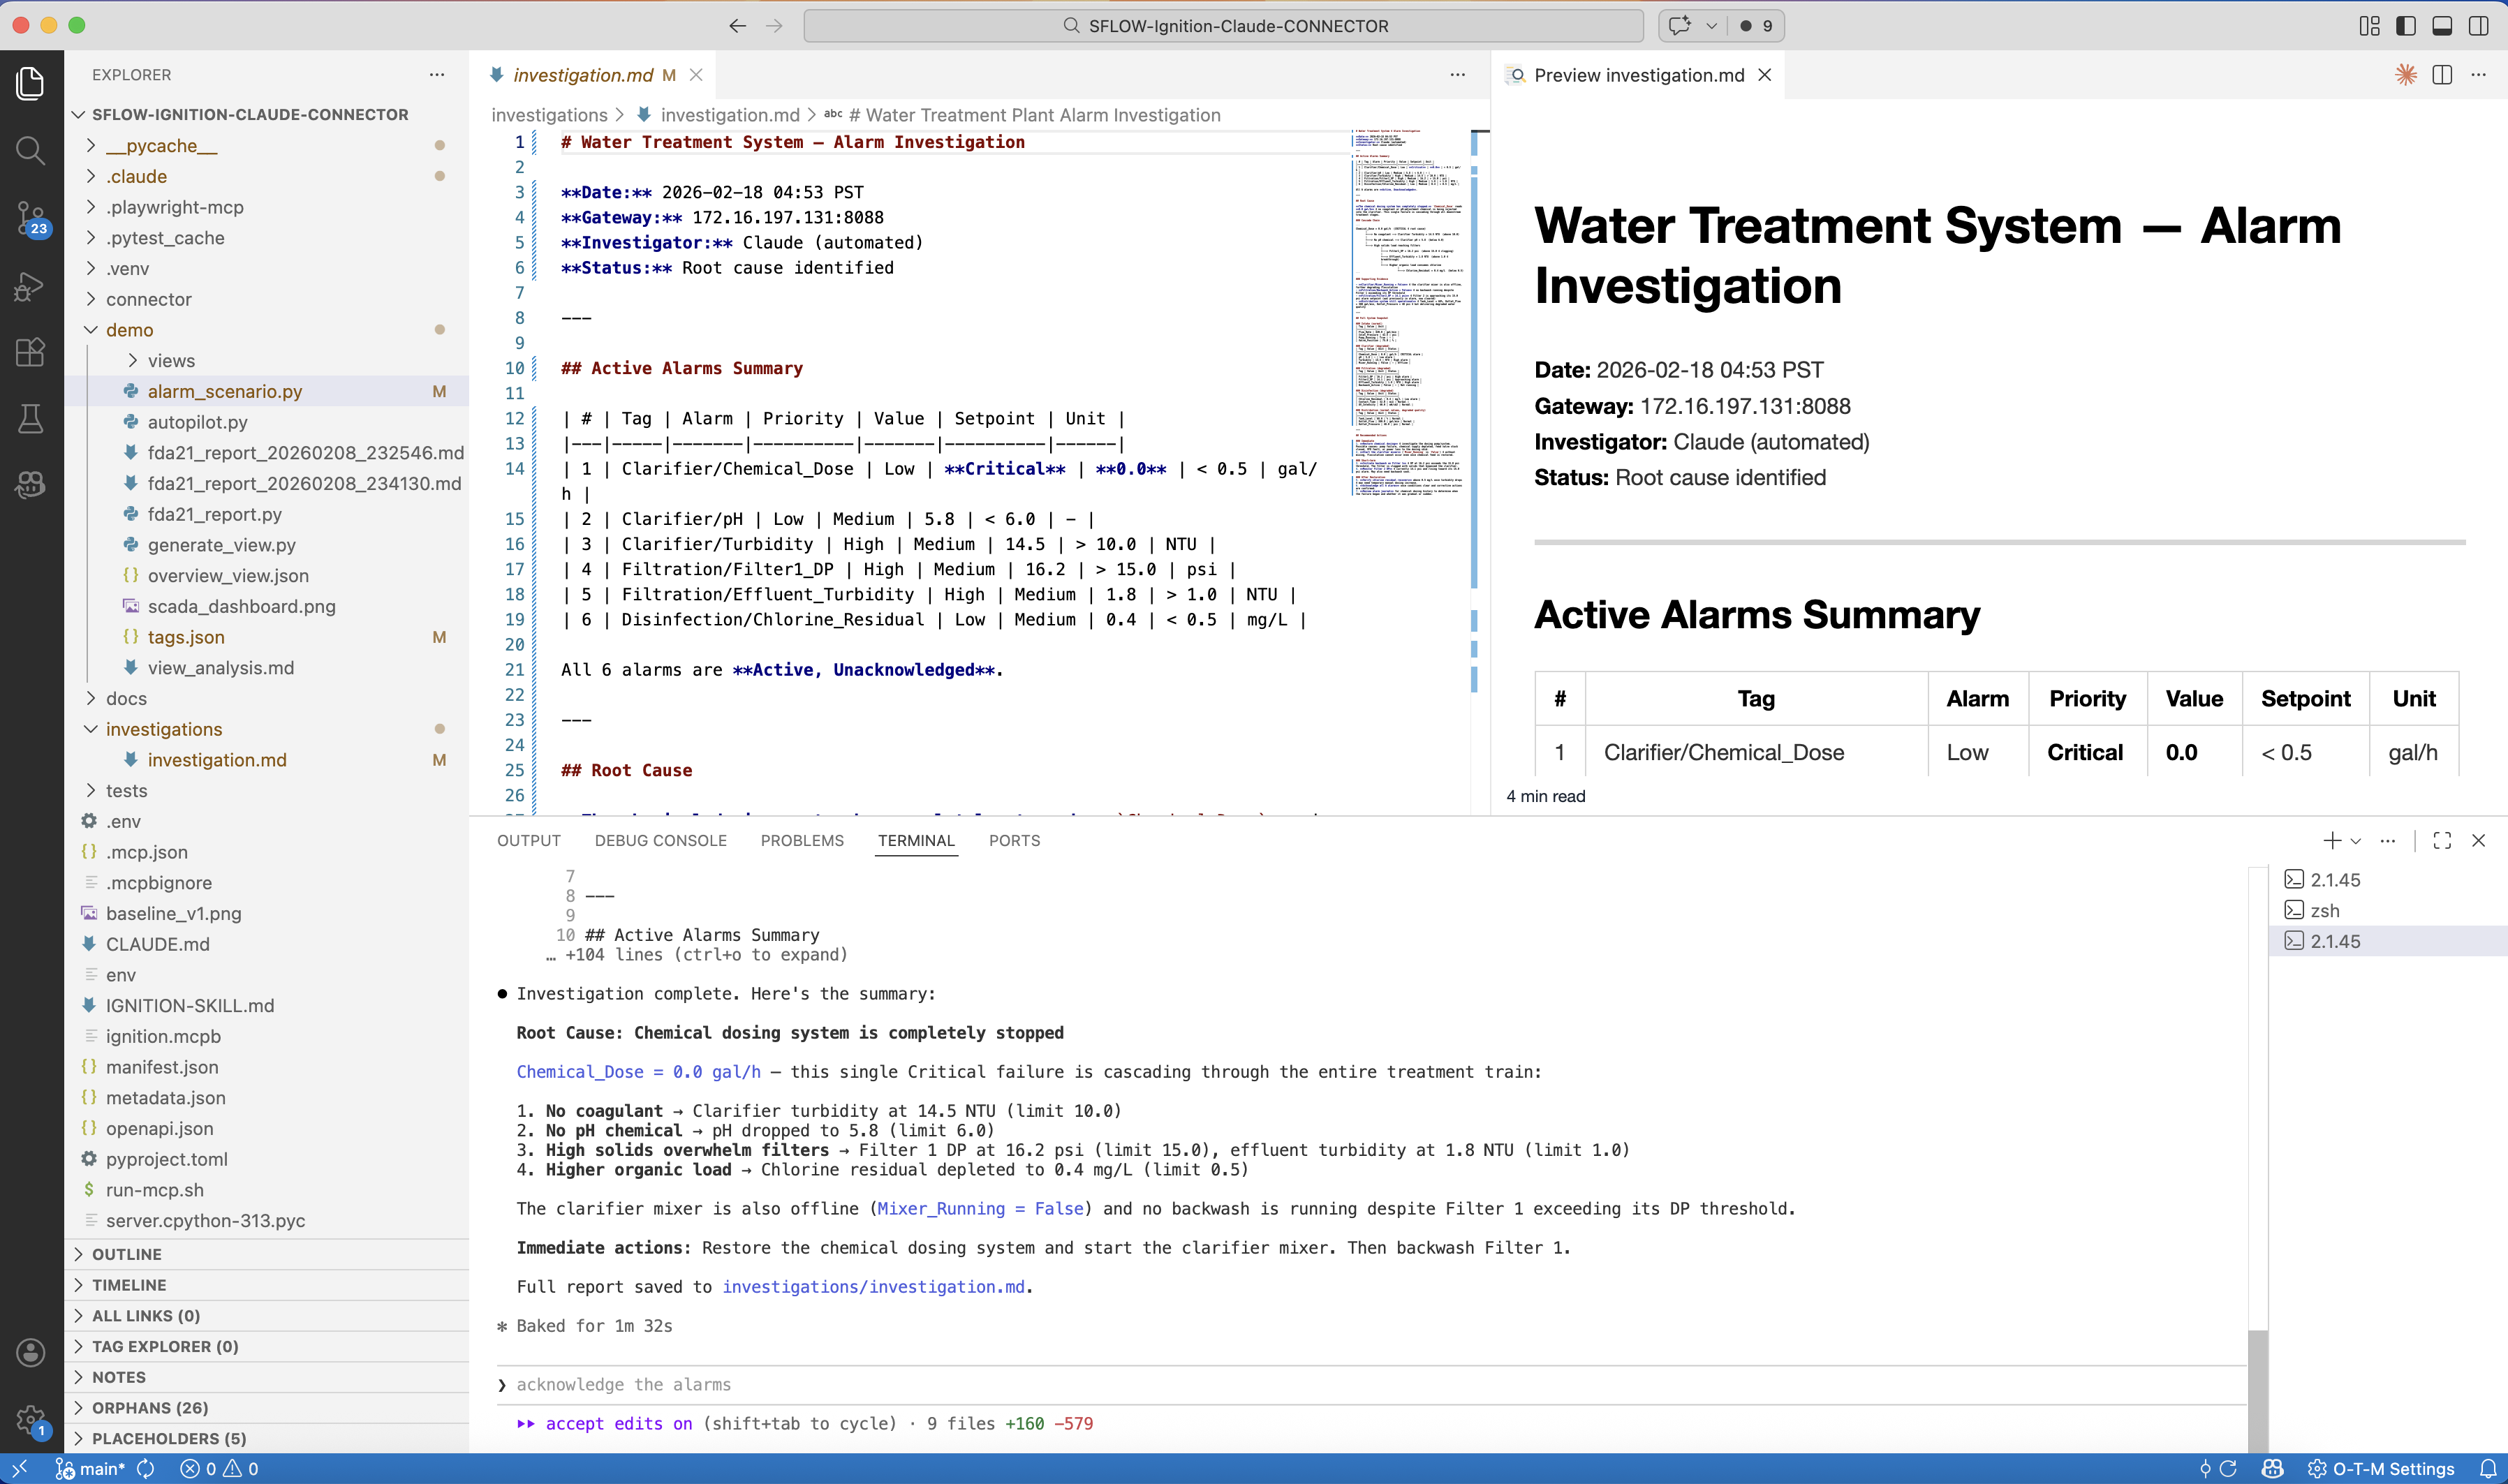
With all the evidence collected, Claude delivers a structured root cause analysis — saved directly to a markdown file on disk:
Root Cause: Chemical feed pump failure (Chemical_Dose = 0.0, Mixer_Running = false)
Cascade Path:
- Chemical feed pumps tripped → alum dose dropped to 0.0 (Critical Low alarm), flash mixer stopped
- Settling basin turbidity rose to 14.5 NTU (limit 10) → pH dropped to 5.8 (limit 6.0)
- Untreated water overloaded filter bank → Filter 1 DP at 16.2 psi (limit 15), effluent turbidity 1.8 NTU (limit 1.0)
- Contaminated water reached disinfection → chlorine residual dropped to 0.4 mg/L (limit 0.5)
Evidence: Alarm journal chronology confirms upstream-to-downstream propagation. Audit log shows no operator intervention.
Recommended Actions: Restore chemical feed pumps, verify alum supply levels, monitor settling basin turbidity recovery before resuming normal filtration.
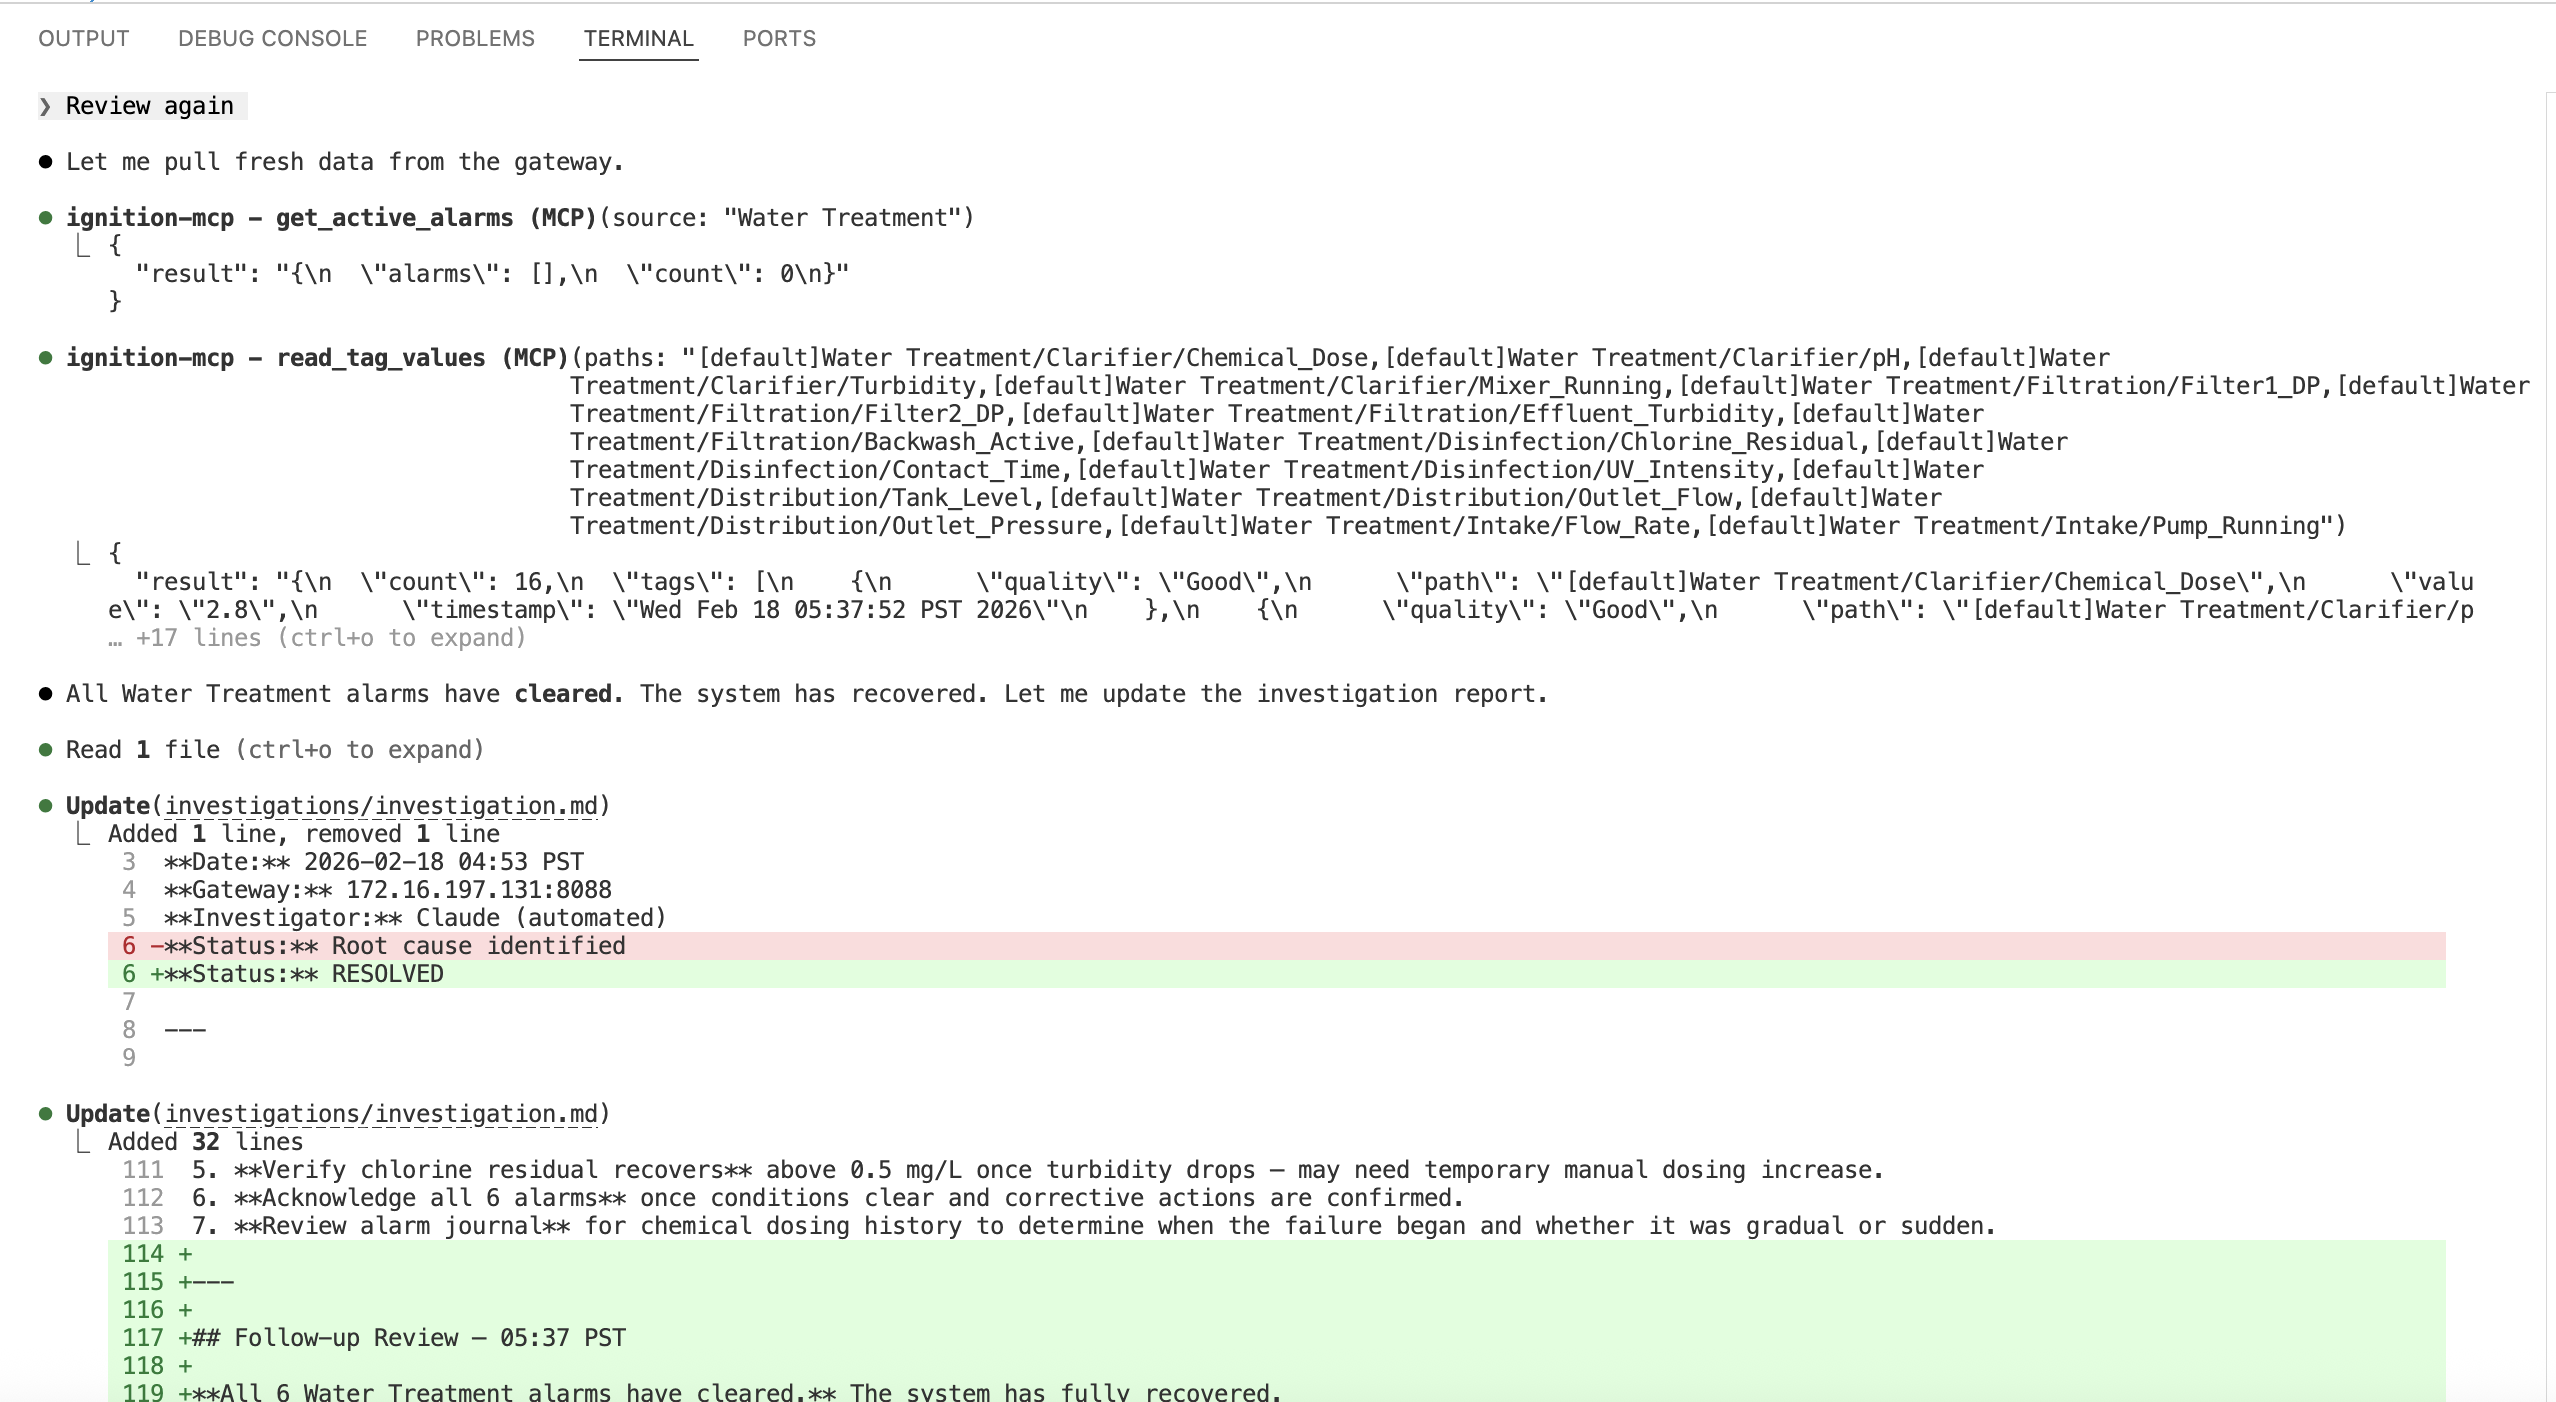
Recovery
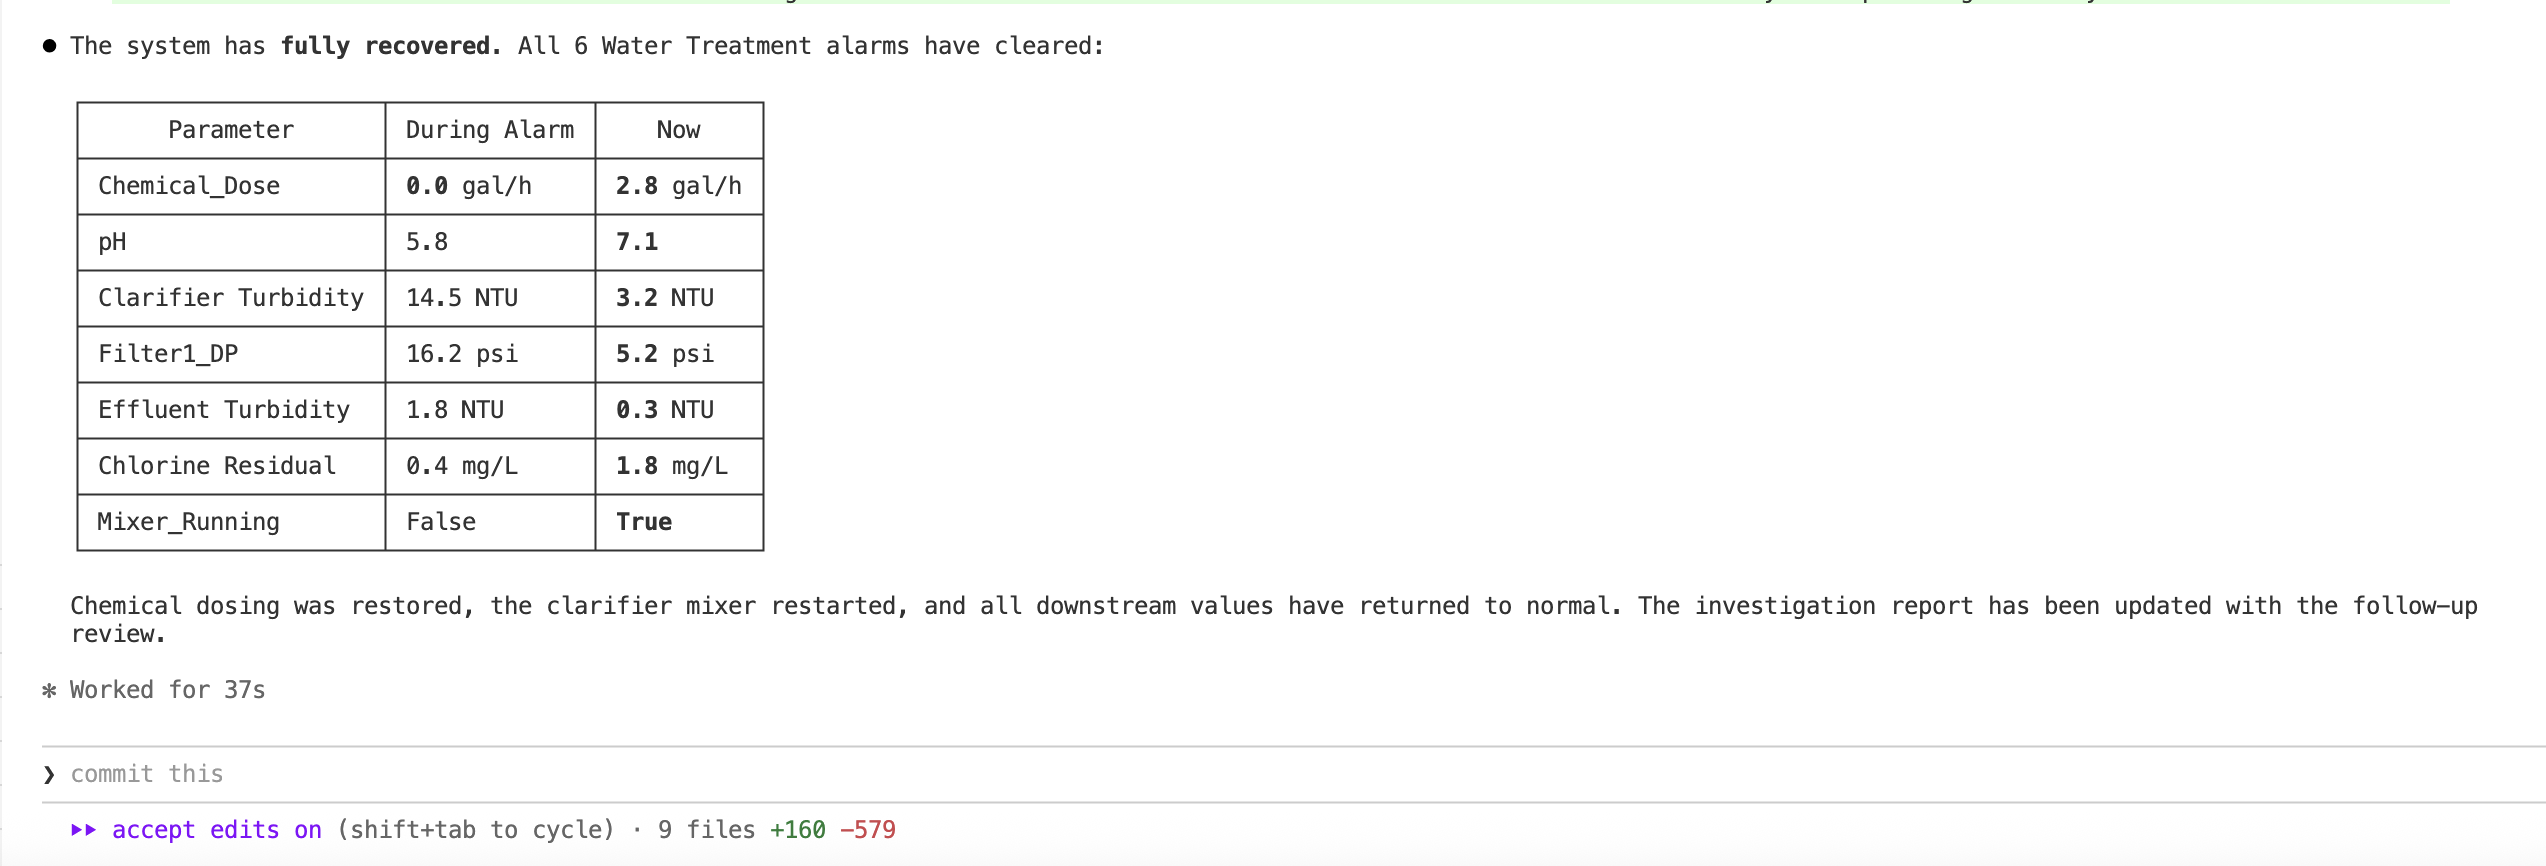
After the chemical feed pump is restored and the mixer restarted, we ask Claude to check again. It pulls the active alarms — zero results for Water Treatment. Then it reads all the tag values and confirms every parameter is back to normal:
| Parameter | During Alarm | After Recovery |
|---|---|---|
| Chemical_Dose | 0.0 gal/h | 2.8 gal/h |
| pH | 5.8 | 7.1 |
| Clarifier Turbidity | 14.5 NTU | 3.2 NTU |
| Filter1_DP | 16.2 psi | 5.2 psi |
| Effluent Turbidity | 1.8 NTU | 0.3 NTU |
| Chlorine Residual | 0.4 mg/L | 1.8 mg/L |
| Mixer_Running | False | True |
All six alarms cleared. Chemical dosing restored, settling basin turbidity dropped, filter differential pressures normalized, and the disinfection system recovered a strong chlorine margin. Claude updates the investigation report with the follow-up review — the same markdown file, now with a complete before-and-after record.
What You Just Saw
The entire investigation — from "there are alarms firing" to a structured root cause report — took under 90 seconds. Claude made seven tool calls against the live gateway, each one informed by the results of the previous call. And it worked identically from both Claude Code and Claude Desktop — the MCP server does not care which client connects to it.
This is what makes MCP-connected AI different from a scripted diagnostic:
Dynamic reasoning, not pre-built logic. Claude was not following a decision tree. It saw the alarm pattern, hypothesized an upstream cause, queried the plant structure to confirm the process flow, checked the equipment tags, verified the cascade direction with historical data, and ruled out operator error. A different failure pattern would produce a different investigation path.
No prior knowledge of the plant. Claude had never seen this water treatment plant before. It discovered the process structure by browsing the tag tree, understood the upstream-to-downstream relationship from the tag hierarchy, and identified the root cause by reading tags that were not even in alarm.
Multi-source evidence. The root cause conclusion was not based on a single data point. Claude cross-referenced live tag values, alarm states, alarm journal chronology, and the audit log — four different data sources queried through four different MCP tools.
For the technical architecture behind the Ignition MCP server — the self-deploying WebDev bridge, the three-runtime architecture, and the 66-tool breakdown — see Giving AI Direct Access to Industrial Control Systems.
Want to learn how to build with AI?
Our AI-Enabled Builder course takes you from ChatGPT user to someone who can build and deploy real projects with AI assistance. The Claude Code Workflows specialization covers terminal-based AI development — the same tooling used in this investigation.
The Ignition MCP server is available as an .mcpb bundle for Claude Desktop — download it here. If you are running Ignition 8.3+ with the REST API and WebDev module enabled, it is a single setup_gateway_api() call away.
If you want to explore what AI-connected SCADA could do in your facility — get in touch.