An AI Agent Built a Live SCADA Dashboard — and What That Says About the Future of Industrial Platforms
What is EnvisionSCADA?
EnvisionSCADA is a Belgian SCADA platform built web-first: the runtime, the page editor, and the administration all live in the browser. Under the hood it exposes a full REST API and — since this spring — its own MCP server, making the entire configuration surface accessible to AI assistants. SCADA (Supervisory Control and Data Acquisition) is the software layer that monitors and controls industrial processes: if a plant has PLCs, sensors, and a control room screen, SCADA ties them together.
A while ago we sat down with Stijn Abeloos, CTO of EnvisionSCADA, around a simple question: how far can an AI agent get on a SCADA platform that is actually open?
Not a chatbot answering questions about documentation. An agent doing real engineering work — configuring devices, creating variables, building operator screens — on a live system, through the same surfaces a human engineer would use.
Stijn opened a public endpoint on demo.envisionscada.com. We connected Claude to it through the EnvisionSCADA MCP server on one side and an agent-controlled browser on the other, gave it the platform documentation, and let it work. Two evenings later, the demo instance was running a complete, animated power-monitoring dashboard the agent had built end-to-end.
Every screenshot below comes from those live sessions. This is not a concept or a mockup.
The Setup
The agent had three surfaces to work with — and the combination is what matters:
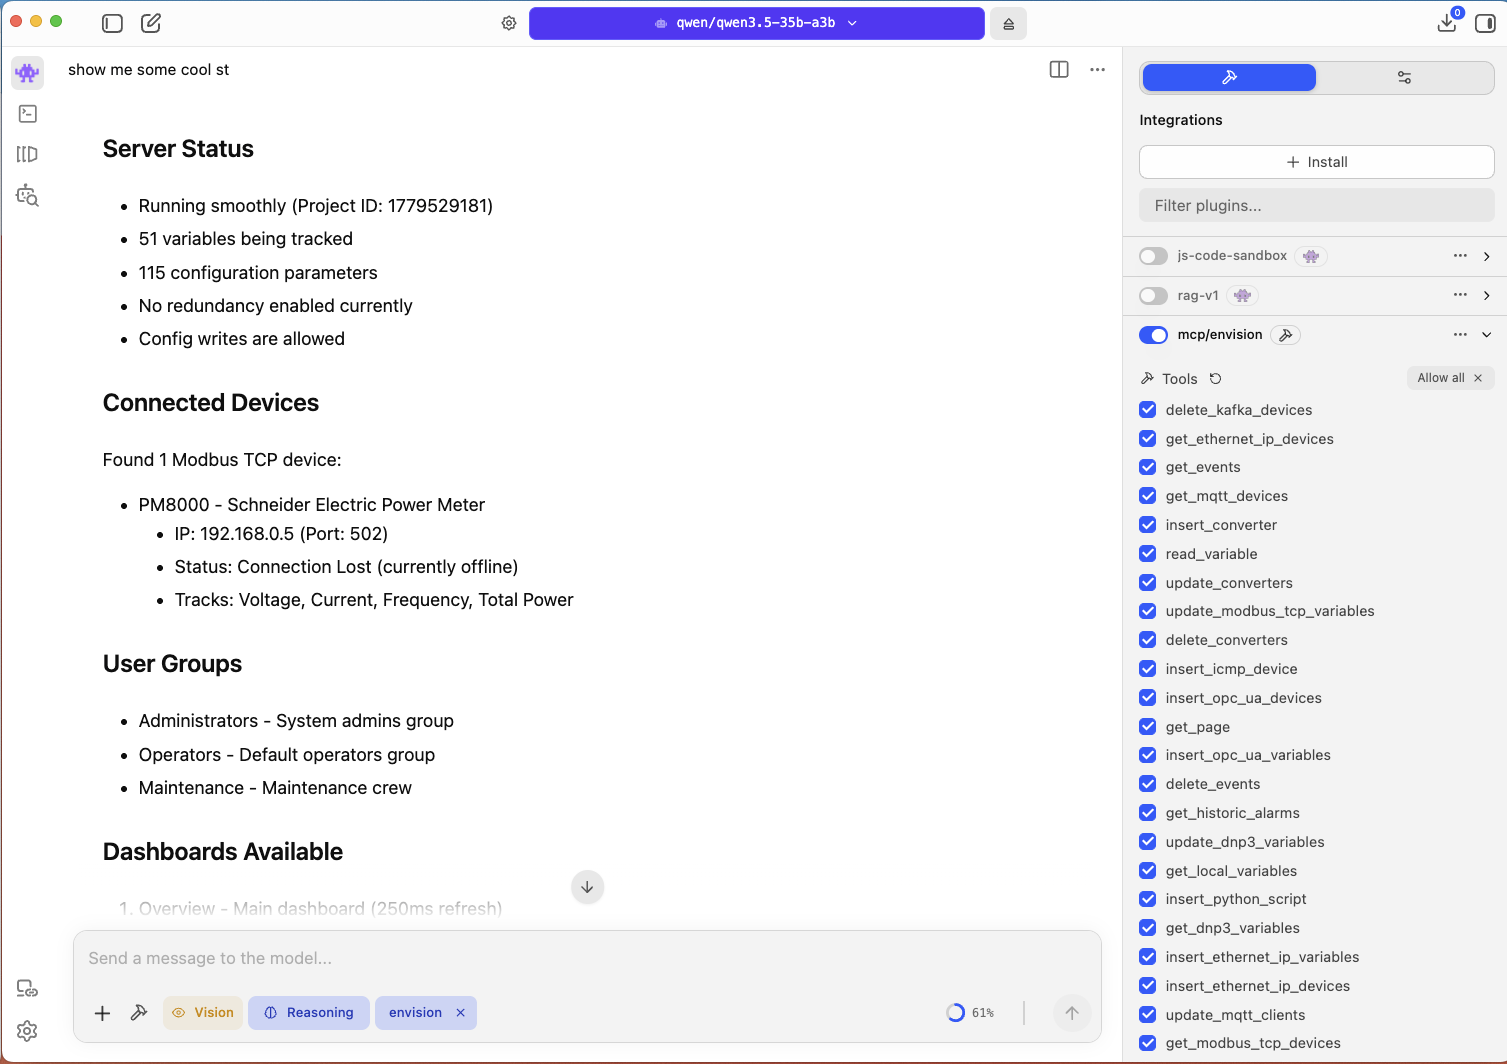
- The EnvisionSCADA MCP server — 105 tools covering runtime values and the full configuration surface: devices, variables, pages, scripts, schedules, users.
- The REST API — the same API that powers the platform's own front-end, available for anything the MCP didn't cover.
- A live browser — an agent-controlled Chrome session logged into the demo, so the agent could see the result of every change it made.
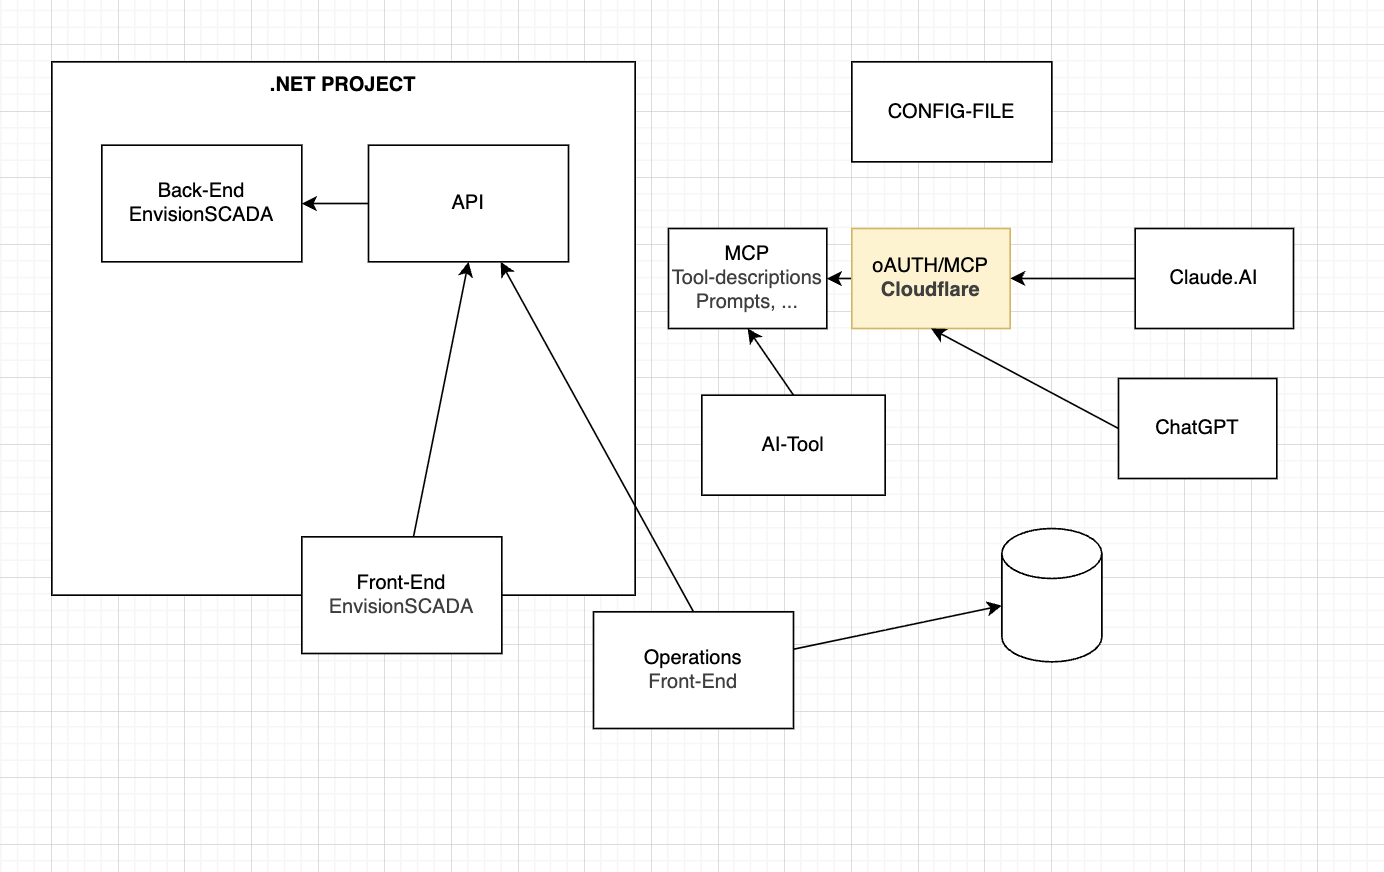
That third surface is the one most platforms can't offer. Because EnvisionSCADA's runtime and editor are plain web applications, the agent could navigate to a page it had just created, look at it, notice what was wrong, and fix it — the same implement-test-refine loop a human engineer runs, just faster.
What the Agent Built
A real device, with a real register map
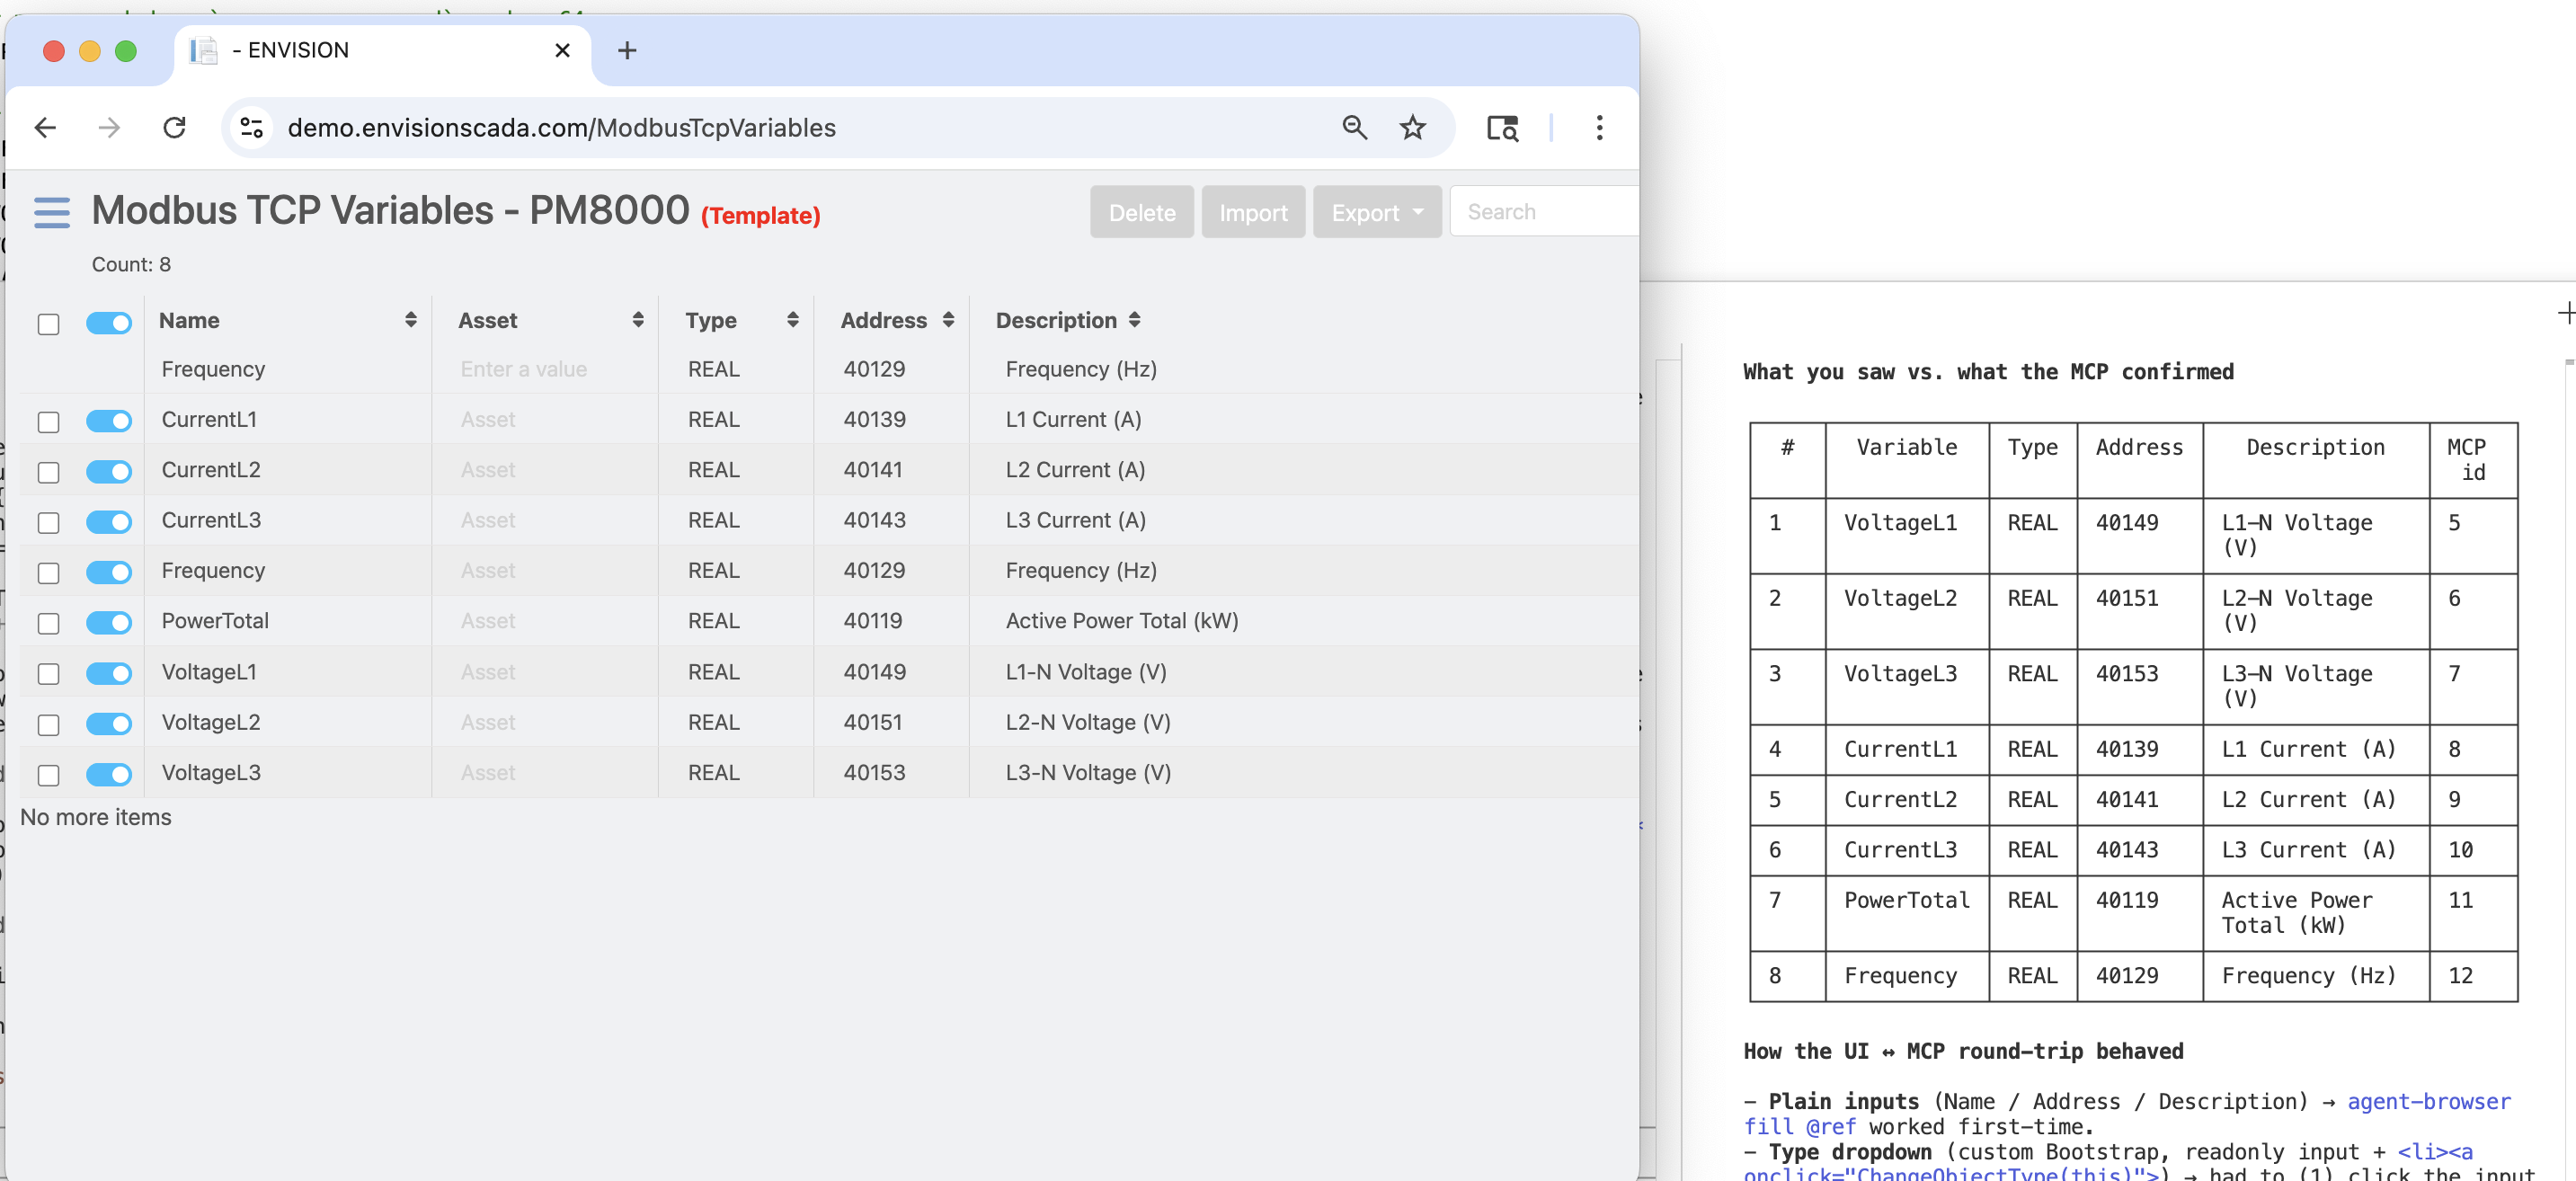
The agent configured a Schneider Electric PM8000 power quality meter as a Modbus TCP device — straight through the MCP, with the configuration pages open in the browser so every change could be confirmed visually. It then created the Modbus variables for the PM8000's standard register map: phase voltages, currents, active power, power factor, frequency, and energy totals.
It also checked its own work. After writing the variables, it read them back through the MCP and compared what the UI showed against what the API confirmed — address by address.
A 30-widget operator dashboard
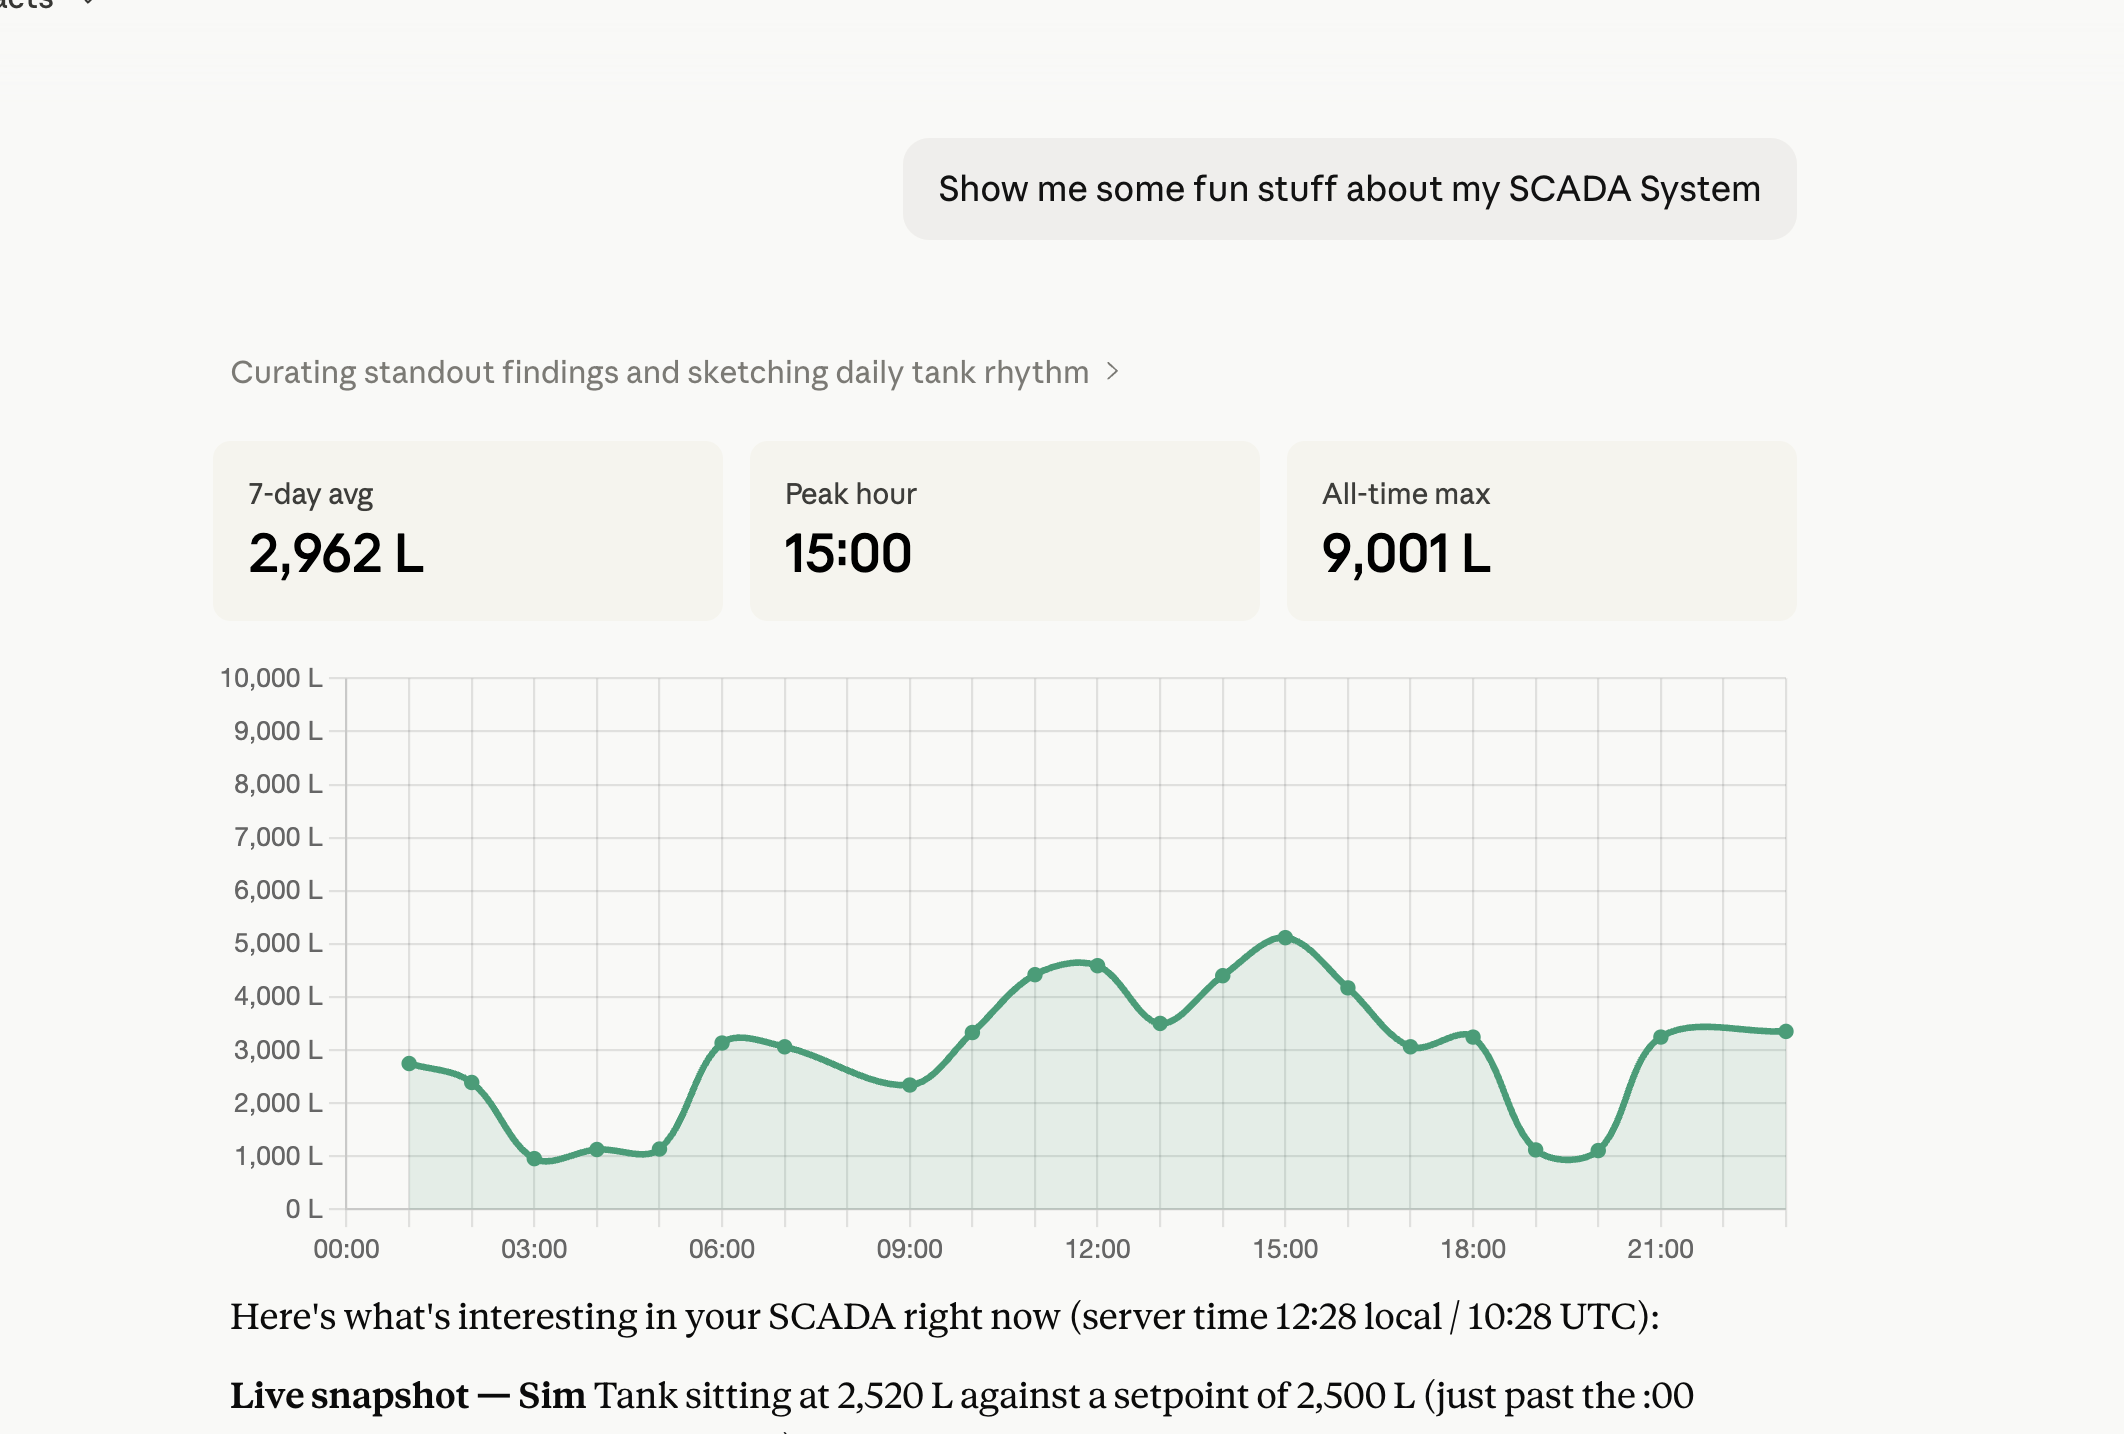
Starting from a blank page, the agent built a complete PM8000 Power Meter dashboard: voltage and current bars per phase, active power and frequency displays, a connection status indicator, and a trend chart backed by the platform's historian.
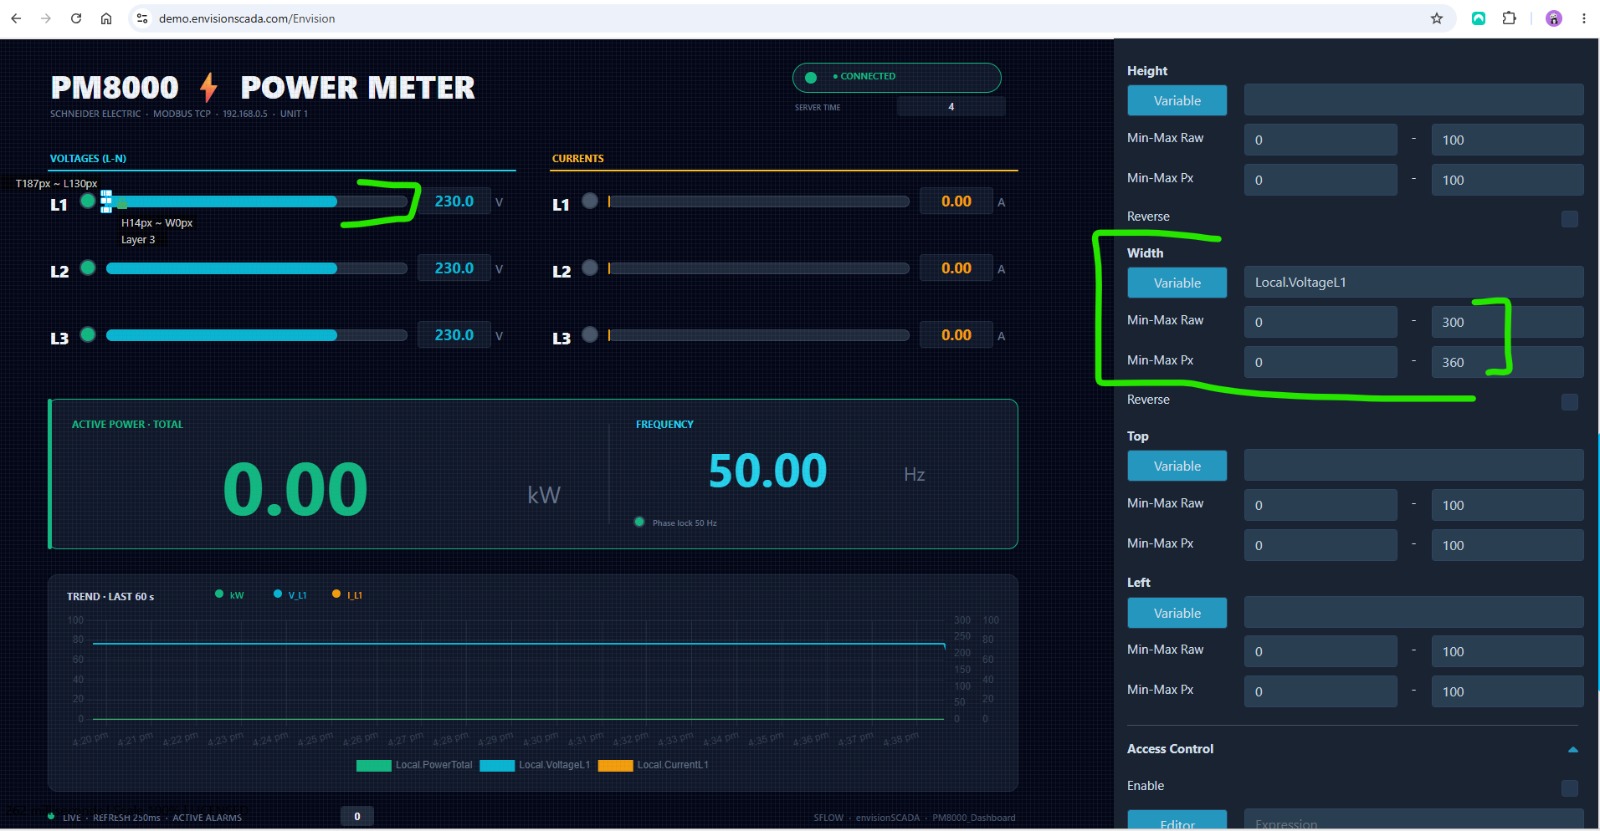
The detail Stijn highlighted in that screenshot says a lot: the blue voltage bar is not a static drawing. The agent bound the bar's width to the live variable through the platform's animation system — a property-panel configuration it had never been shown. It grows and shrinks with the value, exactly the way an operator screen should.
A simulation script, so the dashboard lives
A demo instance has no real PM8000 behind it. So the agent wrote a Python script inside the platform that drives the values with realistic physics — sine-wave variation on voltages, currents, and frequency, plus properly accumulating energy counters — and enabled historian persistence so the trend chart shows genuine history rather than a flat line.
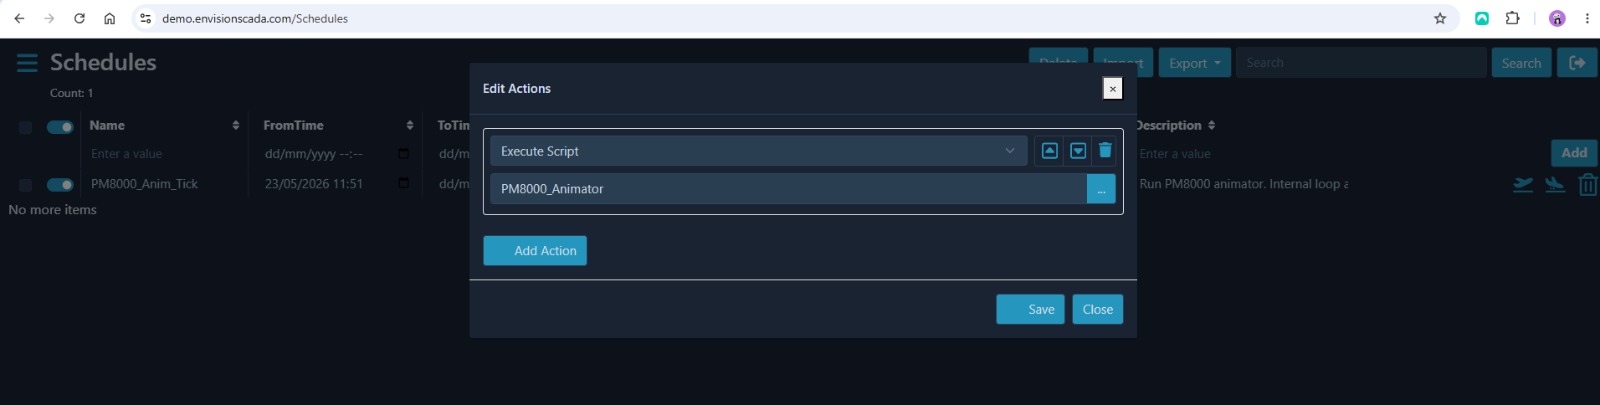
A scheduled action it figured out by itself
To run that script, the agent configured a scheduled action in the platform. Actions are defined as JSON in a specific format — a format that, at the time, was not documented in the MCP server.
Stijn's reaction the next morning, lightly translated: "It's unbelievable that it managed to use the available tools in such a way that it could correctly configure features that were not even documented yet."
There's no magic in the answer. The agent had the platform's manual and export samples in its working folder, an instruction to research how the system works before acting, and a browser to verify each attempt. Give an agent a tight feedback loop — try, observe, correct — and it will discover things that aren't in any prompt. This is the same method we used to build the Ignition CLI: not better prompting, but better loops.
Connecting claude.ai: an OAuth Bridge in an Afternoon
Everything above ran through Claude Code. But most people in an operations team don't live in a terminal — they live in a chat window. So we wanted the same 105 tools available in plain claude.ai.
One obstacle: claude.ai custom connectors speak OAuth 2.1, while EnvisionSCADA's MCP endpoint authenticates with HTTP Basic. The two simply don't plug together.
The fix was a small Cloudflare Worker — around 150 lines of TypeScript — that implements a genuine OAuth 2.1 authorization server (PKCE, dynamic client registration) in front of the MCP endpoint. It serves a login form, validates credentials, and transparently swaps the OAuth token for the upstream Basic header on every request, streaming included.
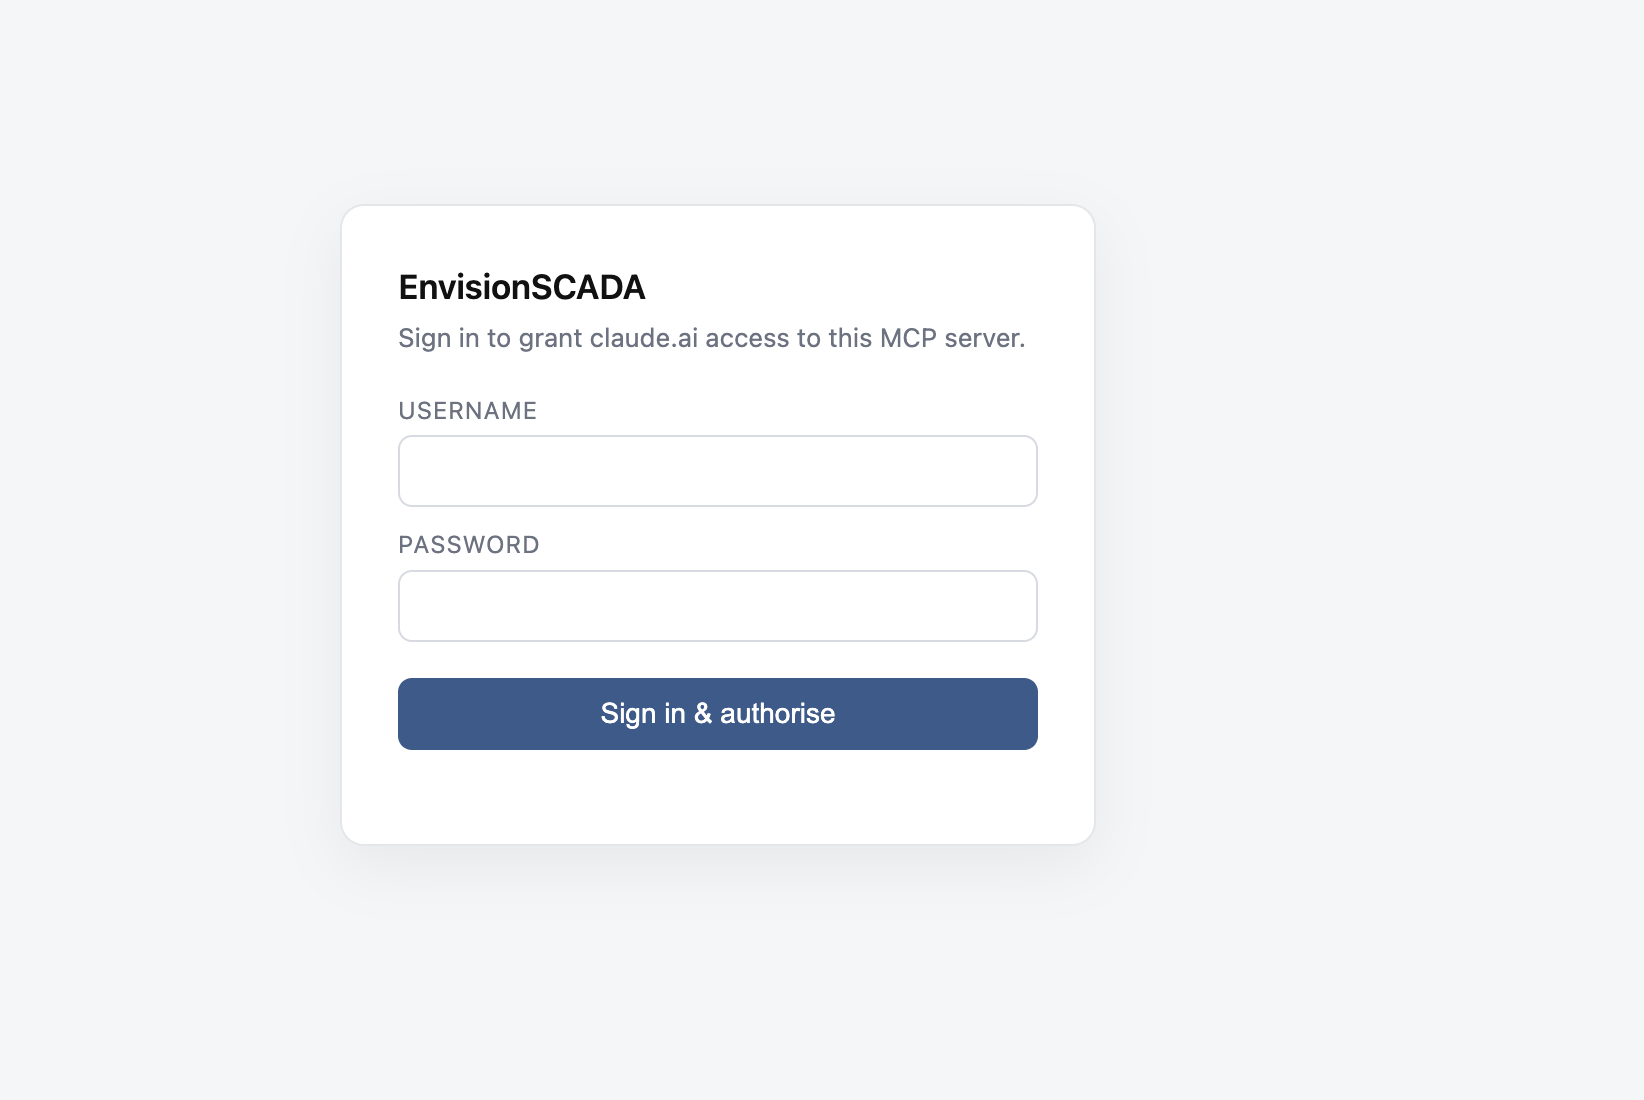
The result: anyone on the team adds the connector in claude.ai, signs in through a friendly login page, and has the full SCADA toolset available in an ordinary chat.
This is worth pausing on. The platform didn't support claude.ai's authentication scheme — and it didn't matter. Because the platform is open, a missing integration is an afternoon of glue code, not a feature request on a vendor roadmap.
Web-First and Open Is Where Agentic Engineering Happens
The interesting question is not "can AI configure a SCADA system?" — you just saw that it can. The interesting question is why it could, here.
AI agents work through the same surfaces humans do: HTTP, JSON, and the browser. A platform that is web-first and API-complete is natively agent-accessible:
- The REST API and MCP server gave the agent hands — every configuration object readable and writable programmatically.
- The browser-based runtime and editor gave it eyes — a live, inspectable view of what its changes actually did.
- Scripting inside the platform gave it room to extend the system when configuration alone wasn't enough.
None of this was built specifically for our experiment. It's just what the architecture provides — to humans and agents alike.
Now contrast that with most of the installed base. The industrial software landscape is full of platforms designed decades ago around thick clients, proprietary protocols, and configuration locked inside binary project files. There is no API surface to hand an agent, and no browser view for it to verify against. Connecting AI to those systems doesn't mean writing an afternoon of glue code; it means waiting for a rebuild.
That's why we keep returning to the same conclusion across projects — whether bridging Ignition to Claude, investigating live alarms with MCP, or connecting business systems: openness is the feature that unlocks all the others. The platforms that expose their full surface over web standards will compound every advance in AI tooling for free. The ones that don't will watch from a distance.
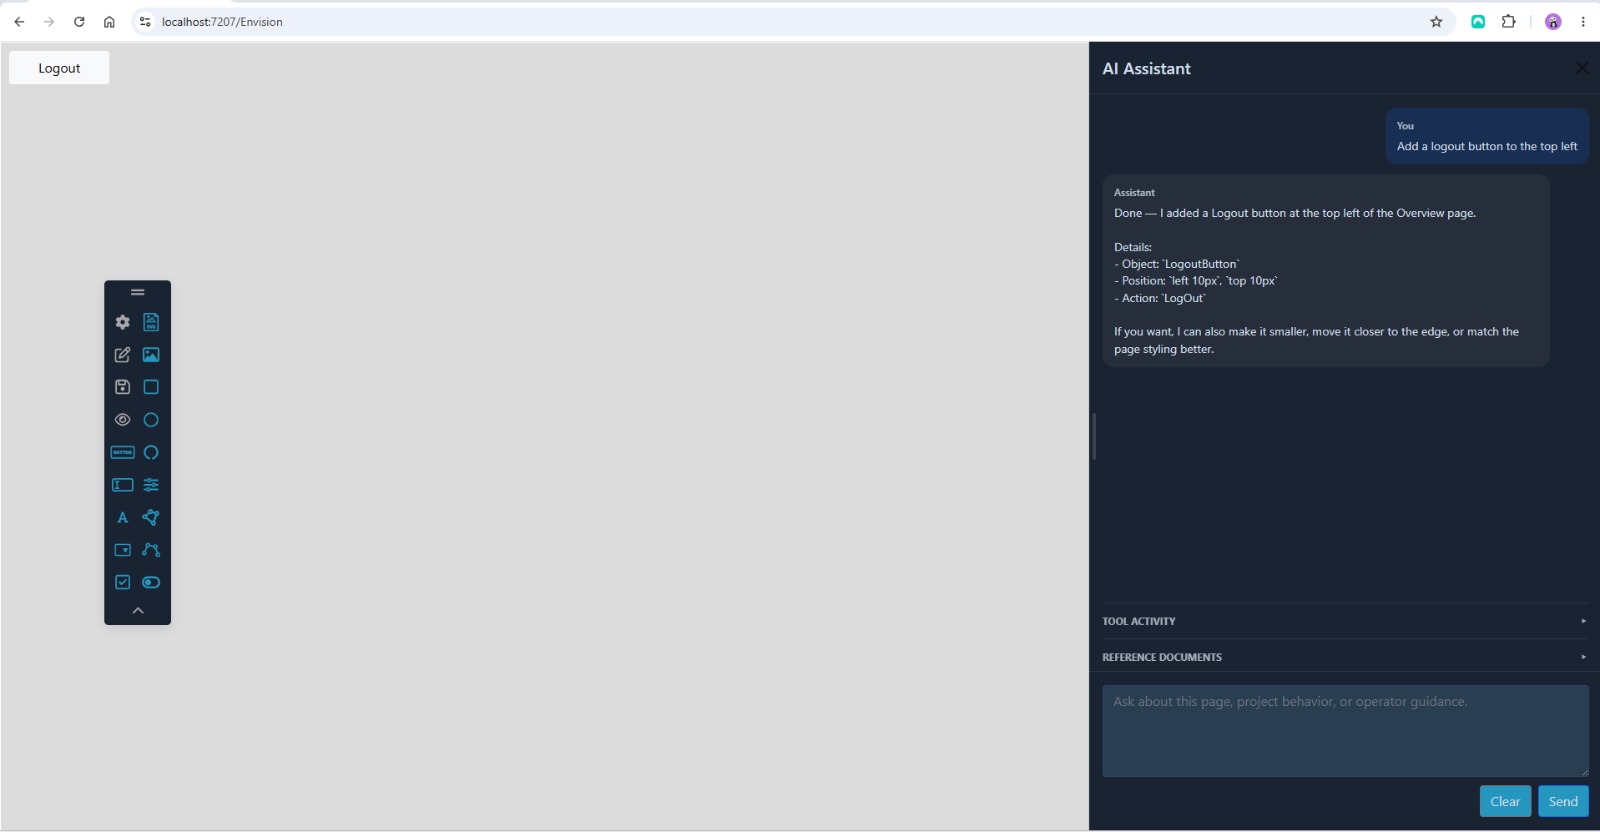
EnvisionSCADA is also showing where this goes next for the people who will never install an MCP client. The platform now embeds its own AI assistant directly in the editor — the same MCP tools, wrapped in a chat panel where an engineer can type "add a logout button to the top left" and watch it happen.
Both delivery models matter, and they share one foundation. Embedded copilots meet automation engineers where they are; external agent workbenches give power users the full reach of the platform. Either way, it's the same open MCP surface underneath.
Takeaways
Open beats integrated. The agent never received special access. Everything it did went through the platform's public surfaces — the same API, the same browser, the same documentation a human engineer gets. That is the whole trick.
The browser is the agent's eyes. The single biggest difference with earlier automation attempts was live visual verification. An agent that can see the runtime catches its own mistakes; an agent working blind ships them.
Feedback loops beat prompt engineering. The scheduler story wasn't clever prompting. It was an agent with documentation, a goal, and a way to test — discovering an undocumented format the same way a human would: by trying.
Glue infrastructure is cheap when the platform is open. A missing auth scheme between claude.ai and the MCP endpoint cost ~150 lines of Cloudflare Worker. On a closed platform, the same gap is impassable.
The factory of the future is an architecture decision. Industry 4.0 has promised AI-integrated plants for a decade. What this experiment shows is that the missing ingredient was never the AI — it's platforms whose surfaces AI can actually reach. Web-first, API-complete, MCP-enabled systems make the promise practical.
Our thanks to Stijn Abeloos and the EnvisionSCADA team for opening up their demo environment and engaging with every finding we sent back. Platforms get better when vendors treat experiments like this as input — and that is exactly what happened here.
Curious what an AI agent could do on the systems running your operation? Get in touch.